If we observe last three-week moves of the USD/CHF pair, an upward sloping trend-channel can be spotted on the four-hour chart.
Presently, 50% Fibonacci retracement of March 07 to 20 downturn, at 1.0010, followed by the channel-resistance, at 1.0025, can act as immediate resistances while 61.8% Fibonacci retracement near 1.0035 and 1.0050/55 area could challenge buyers then after.
If at all prices manage to conquer 1.0055 upside barrier, 1.0070, 1.0085 and 1.0110 may entertain bulls ahead of pleasing then with 1.0125.
Meanwhile, 0.9980 and channel-support near 0.9960 can limit the quote’s near-term declines, a break of which might recall 0.9930 and 0.9910 on the chart.
Further, 61.8% Fibonacci expansion (FE) of the pair’s moves since March 08, at 0.9870, could question sellers past-0.9910.
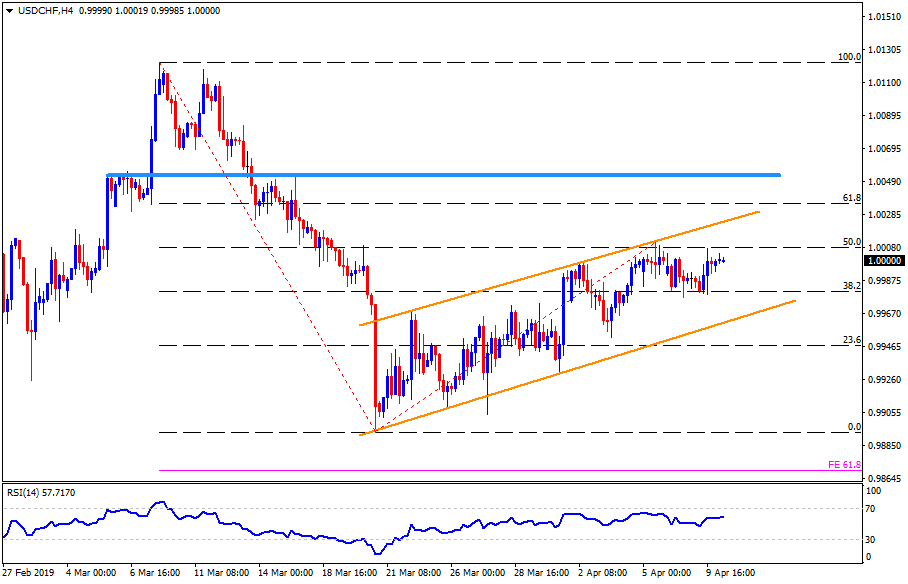
USD/CHF 4-Hour chart
Trend: Bullish
