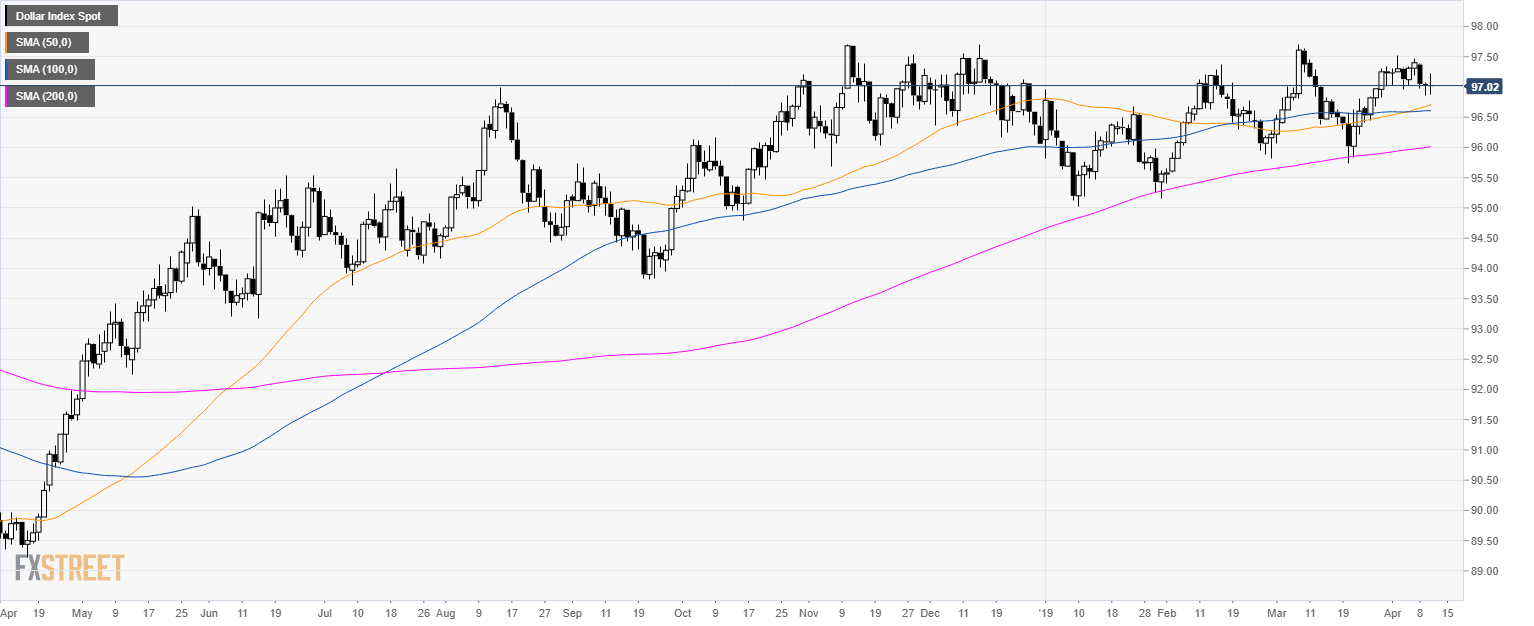
DXY daily chart
- The US Dollar Index (DXY) is trading in a bull trend above its 200-day simple moving average (SMA).
- The FOMC minutes at 18.00 GMT can lead to high volatility especially in USD-related currency pairs.
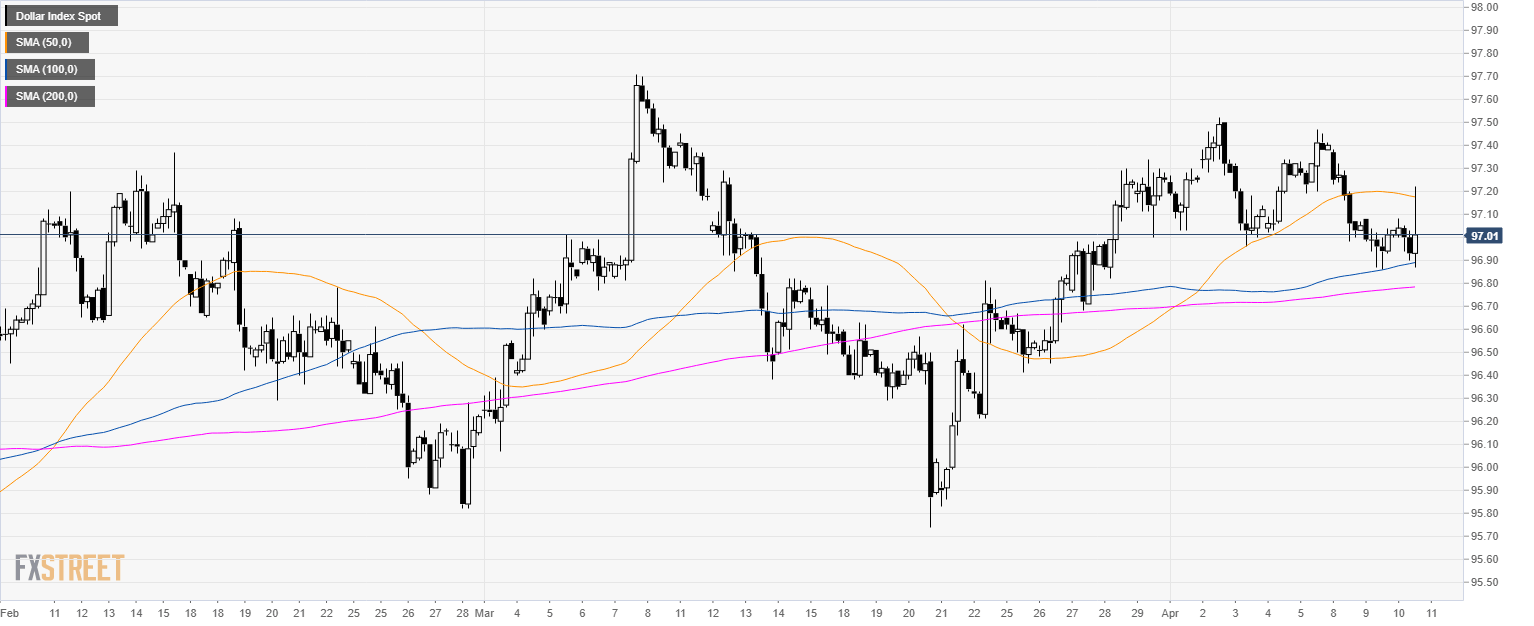
DXY 4-hour chart
- DXY is trading near the important level of 97.00 figure and above the 100 and 200 SMA.
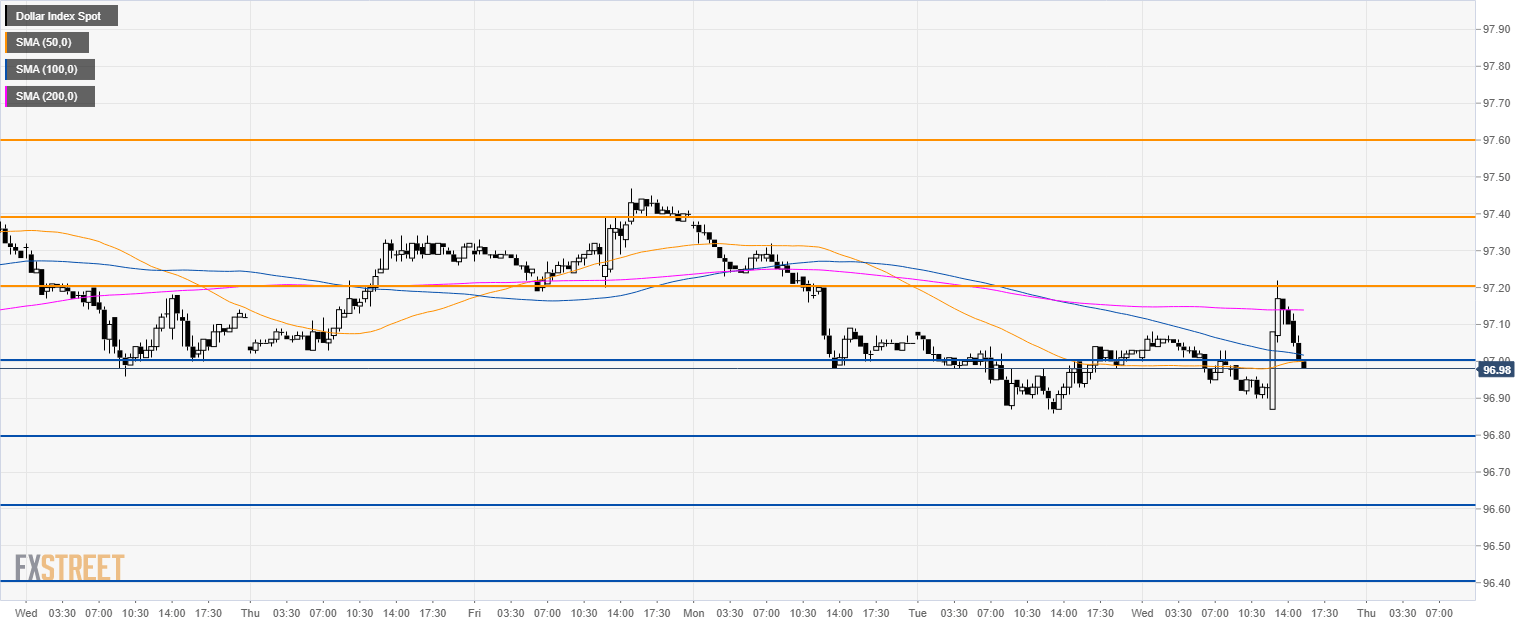
DXY 30-minute chart
- DXY rejected 97.20 resistance and the 200 SMA.
- Bulls seem to have run of steam. A break below 97.00 can see the acceleration of the decline towards 96.80 and 96.60 level.
- Resistance is seen at 97.20, 97.40 and 97.60 level.
Additional key levels
