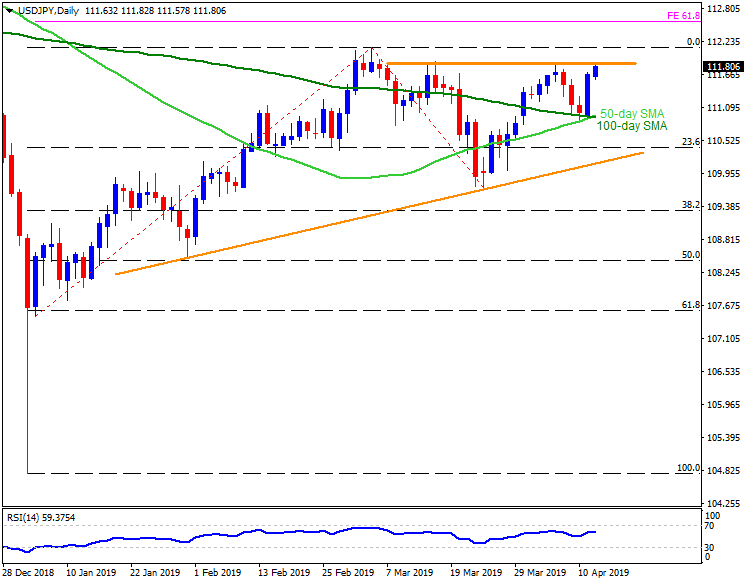
USD/JPY daily chart
- Having recovered from 50-day and 100-day simple moving averages (SMAs), the USD/JPY pair trades near 111.80, the highest level in a week.
- However, the pair still needs to surpass 111.80/90 horizontal-area comprising the pair’s highs marked since March 07 in order to escalate recent up-moves towards March month high near 112.15. In a case, the quote rallies beyond 112.15, 61.8% Fibonacci expansion (FE) of its January 04 to March moves, near 112.60, could please buyers.
- On the downside, 111.30 can offer immediate support ahead of dragging the quote to 50-day and 100-day SMA confluence region around 110.90, a break of which highlights the importance of an upward sloping trend-line stretched since January-end, around 110.15 now.
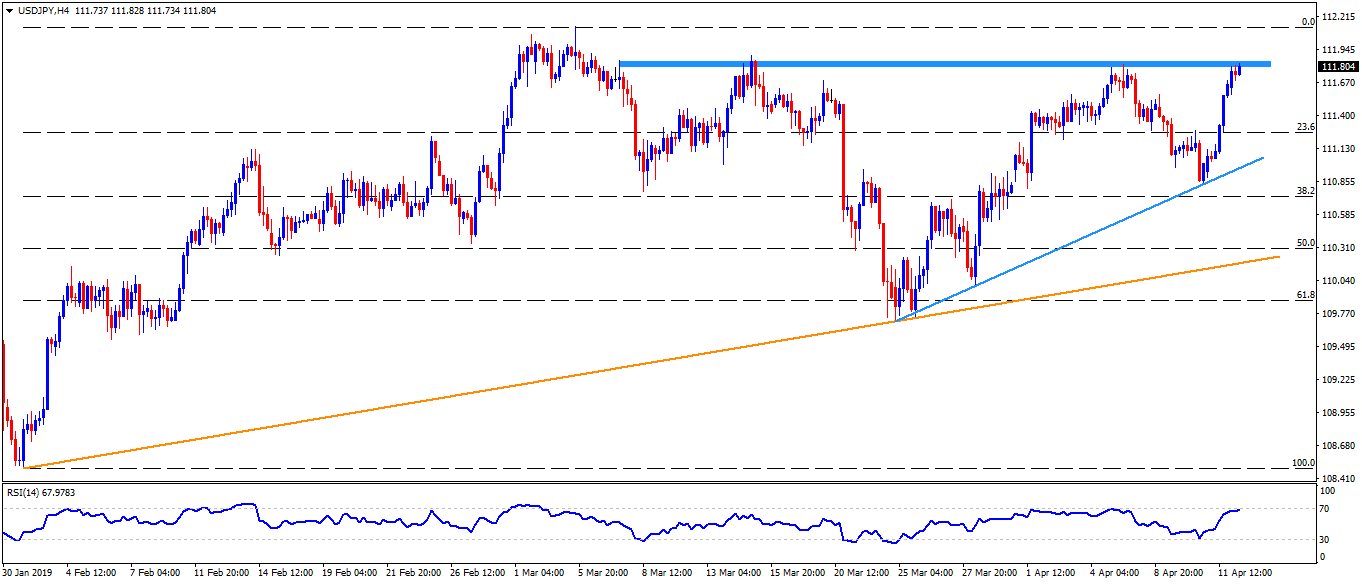
USD/JPY 4-Hour chart
- 111.60 and 109.70 can act as additional supports.
- 112.00 seem an extra halt during the pair’s rise past-111.90.
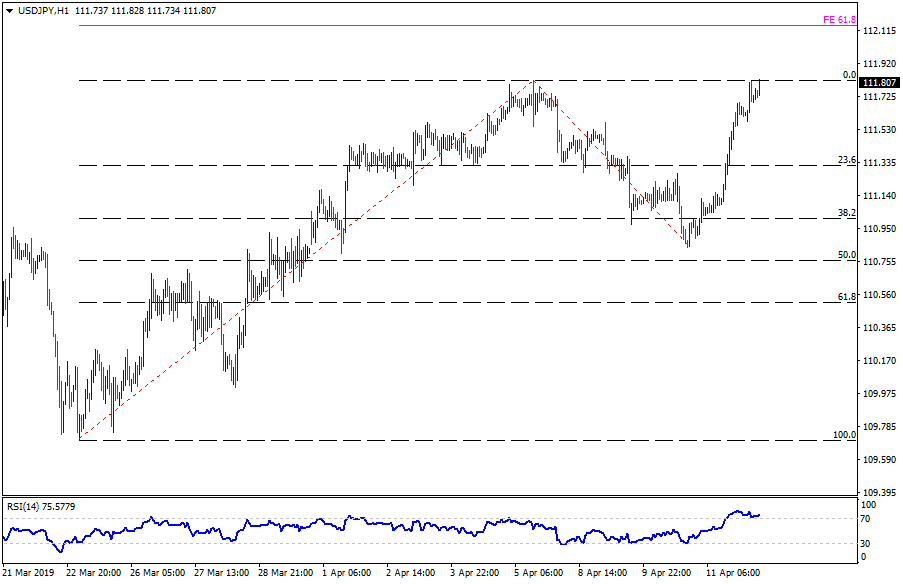
USD/JPY hourly chart
- 111.70 seems the closest support with 112.20 (comprising 61.8% Fibonacci expansion) likely being an extra resistance point to watch.