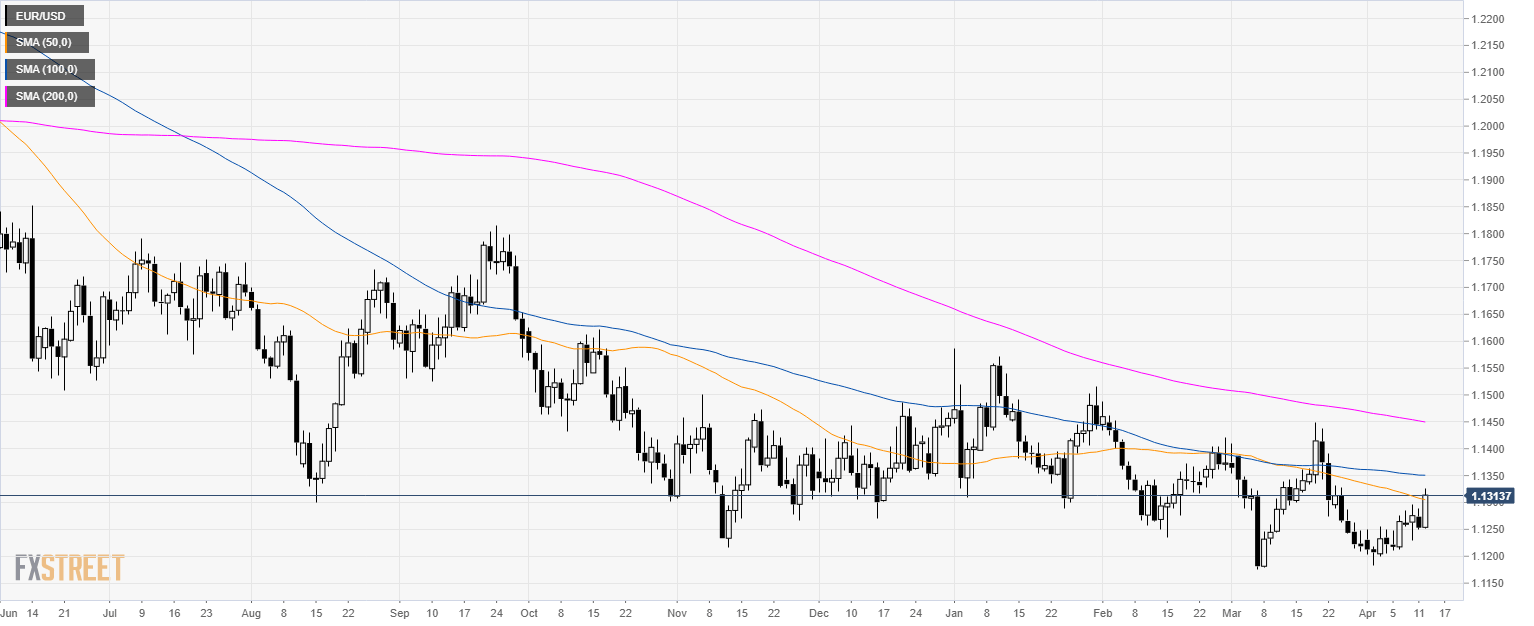
EUR/USD daily chart
- EUR/USD is trading in a bear trend below its 200-day simple moving average (SMA).
- The Michigan Consumer Sentiment Index for April at 14.00 GMT will likely dictate the direction of the currency pair in the New York session.
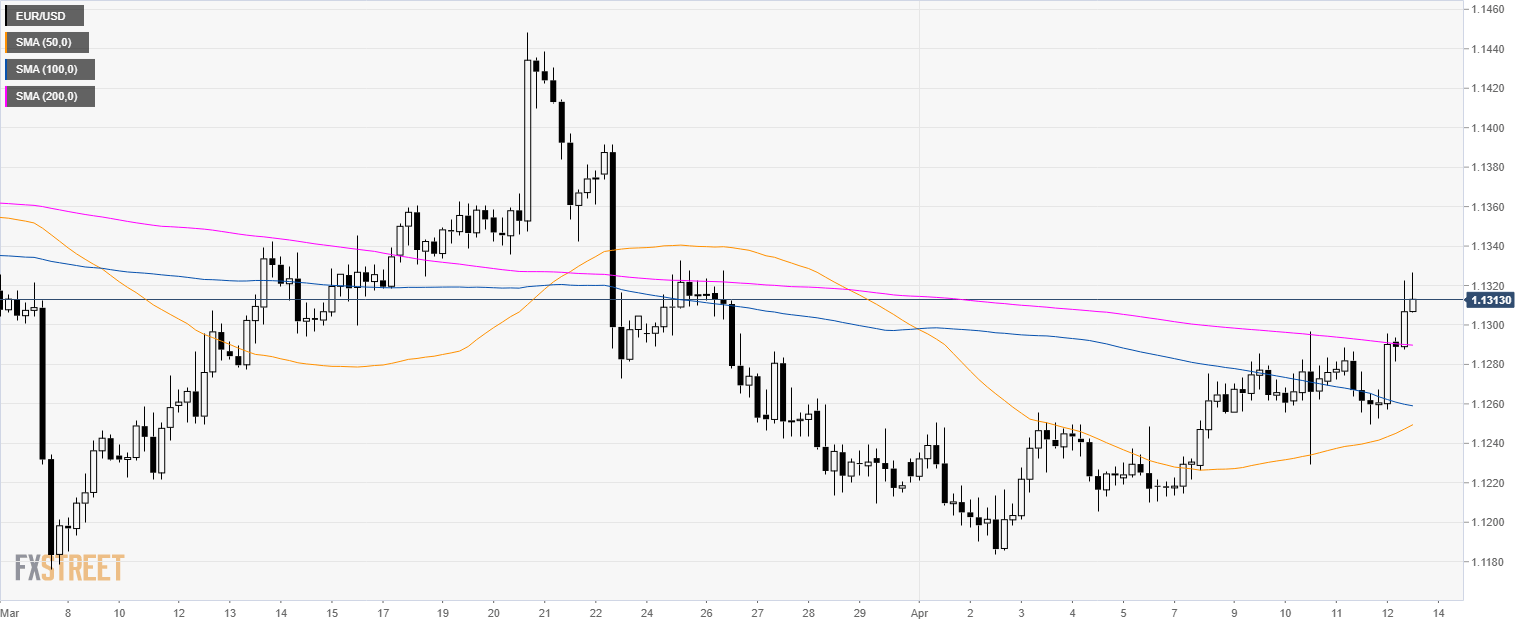
EUR/USD 4-hour chart
- EUR/USD is trading above the main SMAs suggesting a bullish bias in the medium-term.
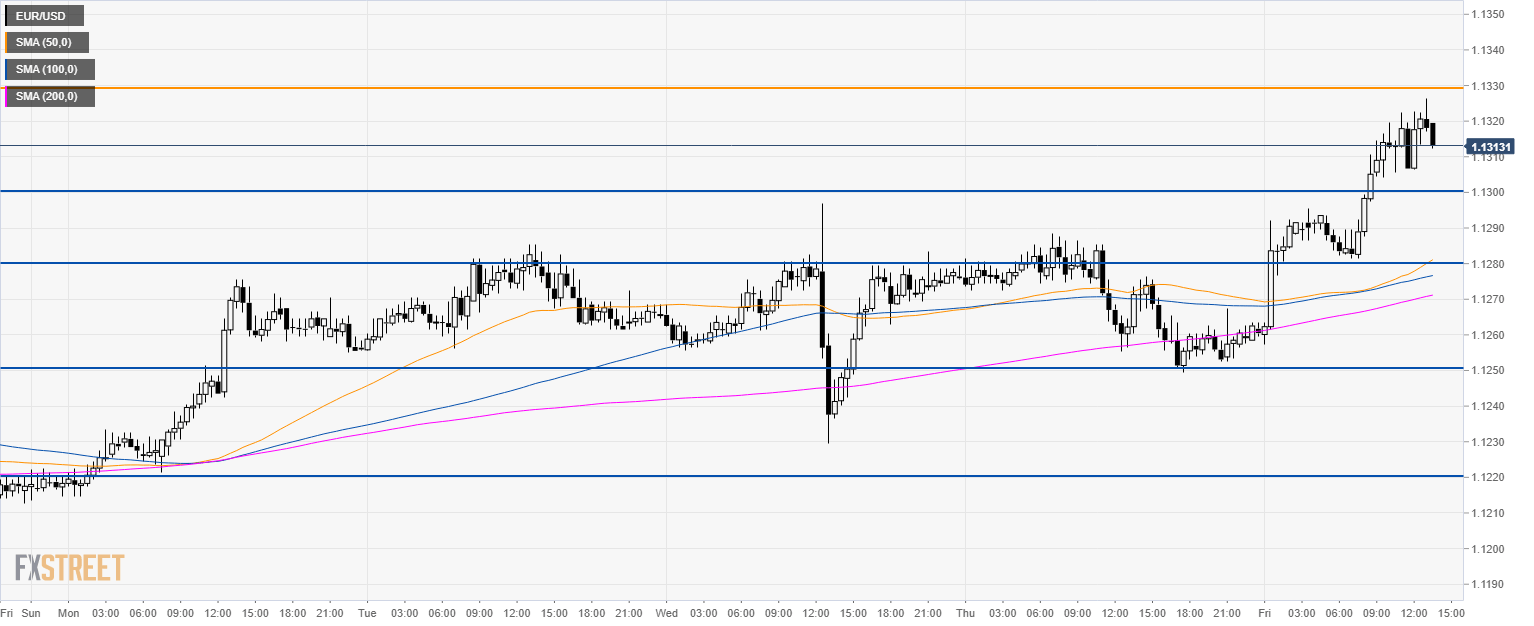
EUR/USD 30-minute chart
- EUR/USD is trading above its main SMAs suggesting a bullish bias in the short-term.
- EUR/USD found tough resistance at 1.1330 in the New York session. 1.1330 is the level to beat for bulls if they want to move up to 1.1360 and 1.1390 level.
- Meanwhile to the downside bears are looking at 1.1300, 1.1280 and 1.1250 level.
Additional key levels
