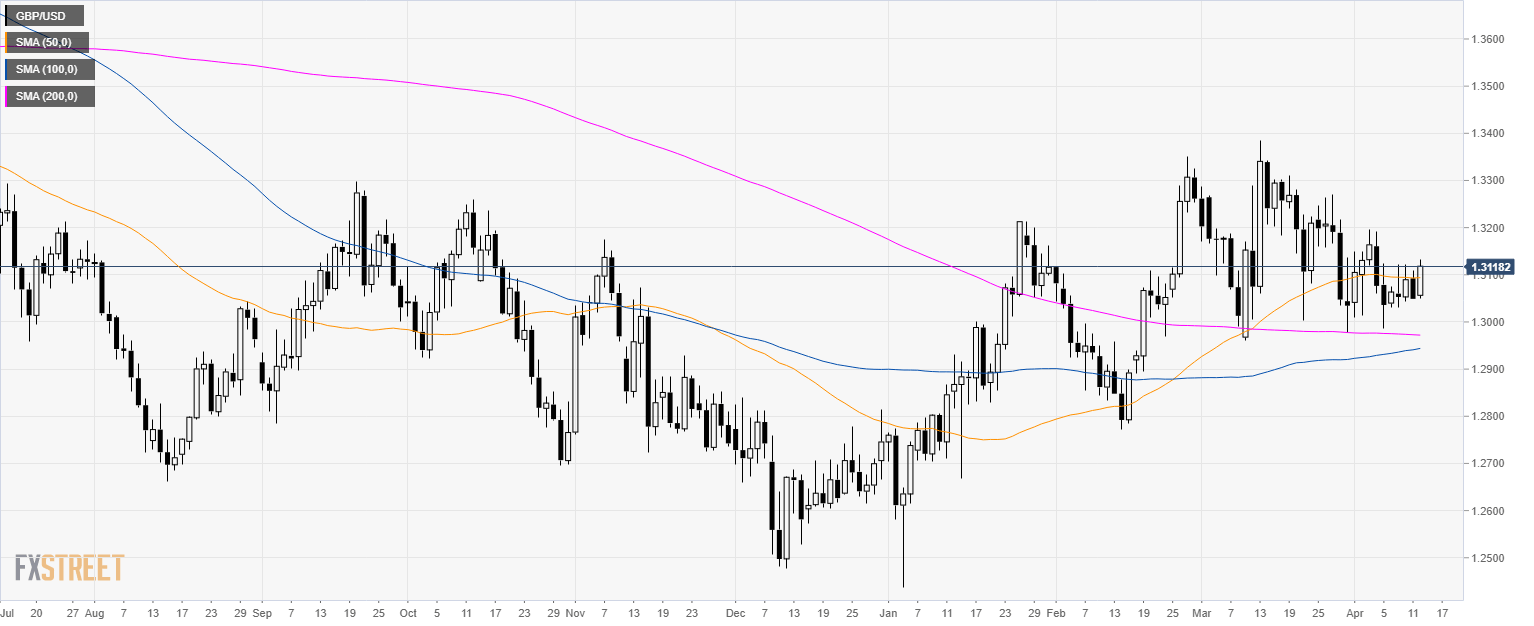
GBP/USD daily chart
- GBP/USD is consolidating just above the 50-day simple moving average (SMA).
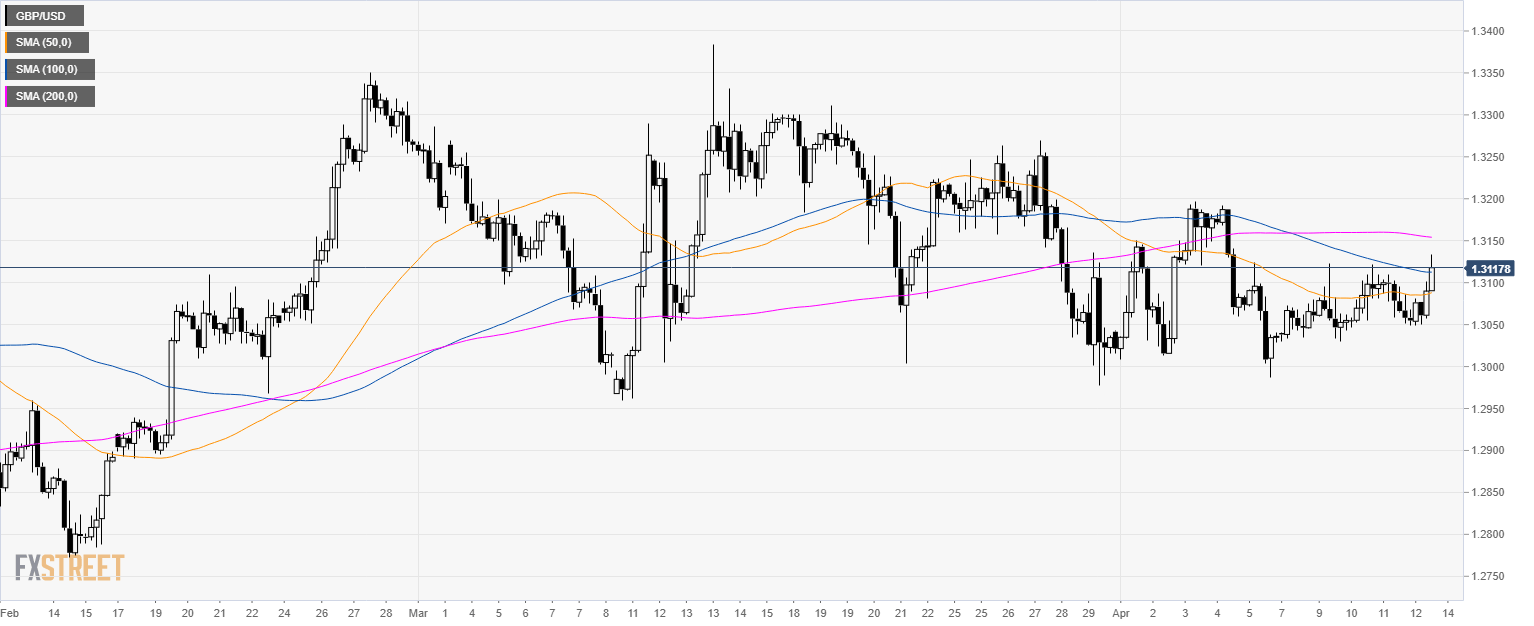
GBP/USD 4-hour chart
- GBP/USD is stuck between the 100 and 200 SMA.
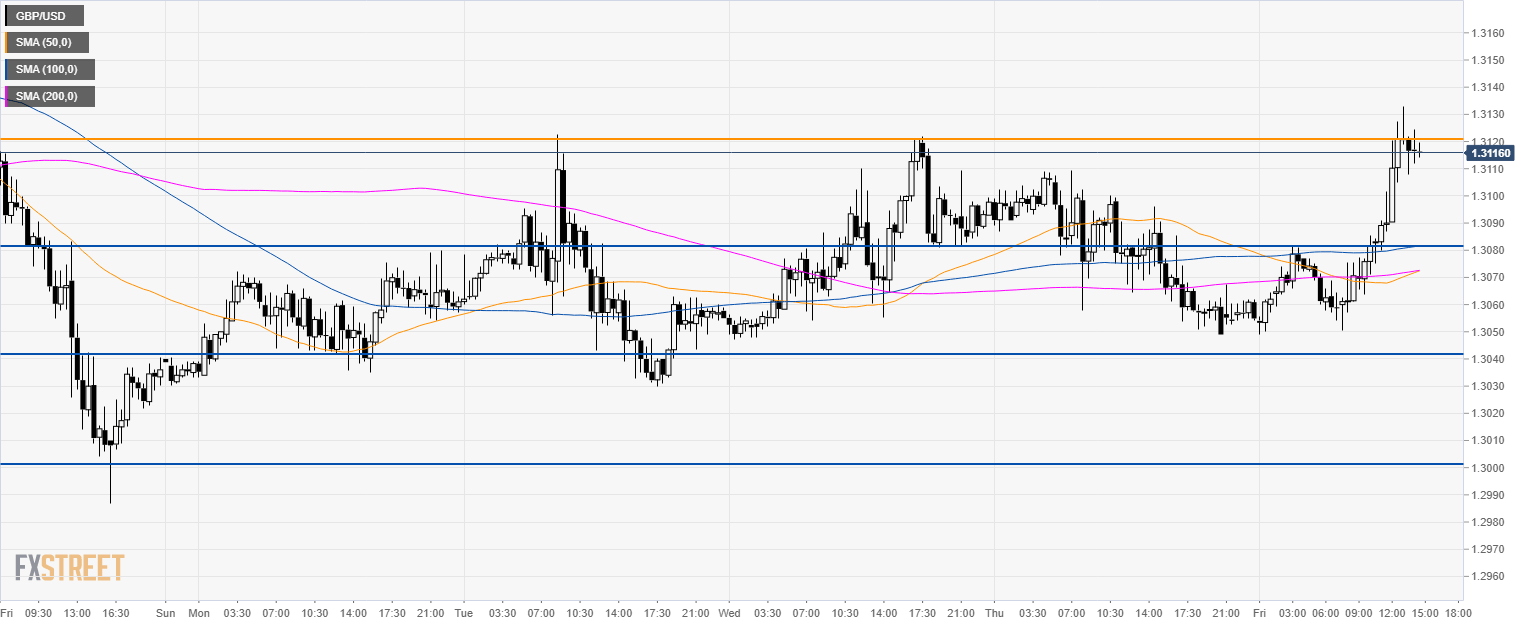
GBP/USD 30-minute chart
- GBP/USD reached a new weekly high but it remains stuck in a range below 1.3120 resistance.
- Bears can reach 1.3080 and 1.3040 level to the downside if they gather enough steam.
- On the flip side, bulls need a clear break above 1.3120 resistance to move up to the 1.3200 handle.
Additional key levels
