Gold is currently on the defensive below the 100-day moving average at $1,288 and could soon drop to the descending triangle support of $1,282.
Daily chart
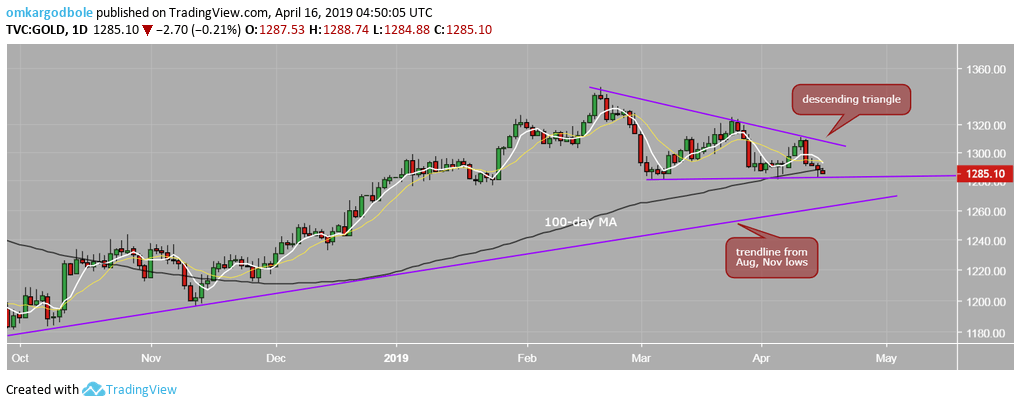
A close below $1,282 would confirm triangle breakdown or bullish-to-bearish trend change and expose the support of the trendline connecting August and November lows, currently at $1,261.
The bearish close looks likely as the yellow metal seems to have found acceptance under the key 100-day MA line with the 5- and 10-day MAs trending south.
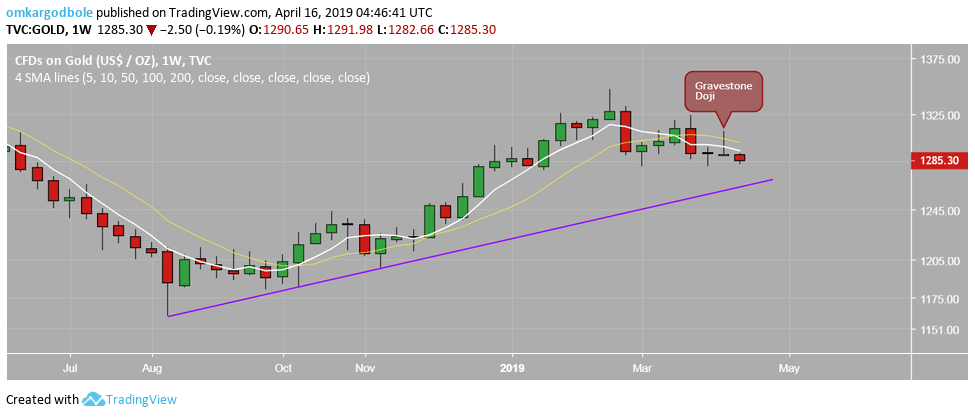
Supporting the bearish case is the previous week’s gravestone doji candle and the downward sloping 5- and 10-week MAs.
Weekly chart
Trend: Bearish
