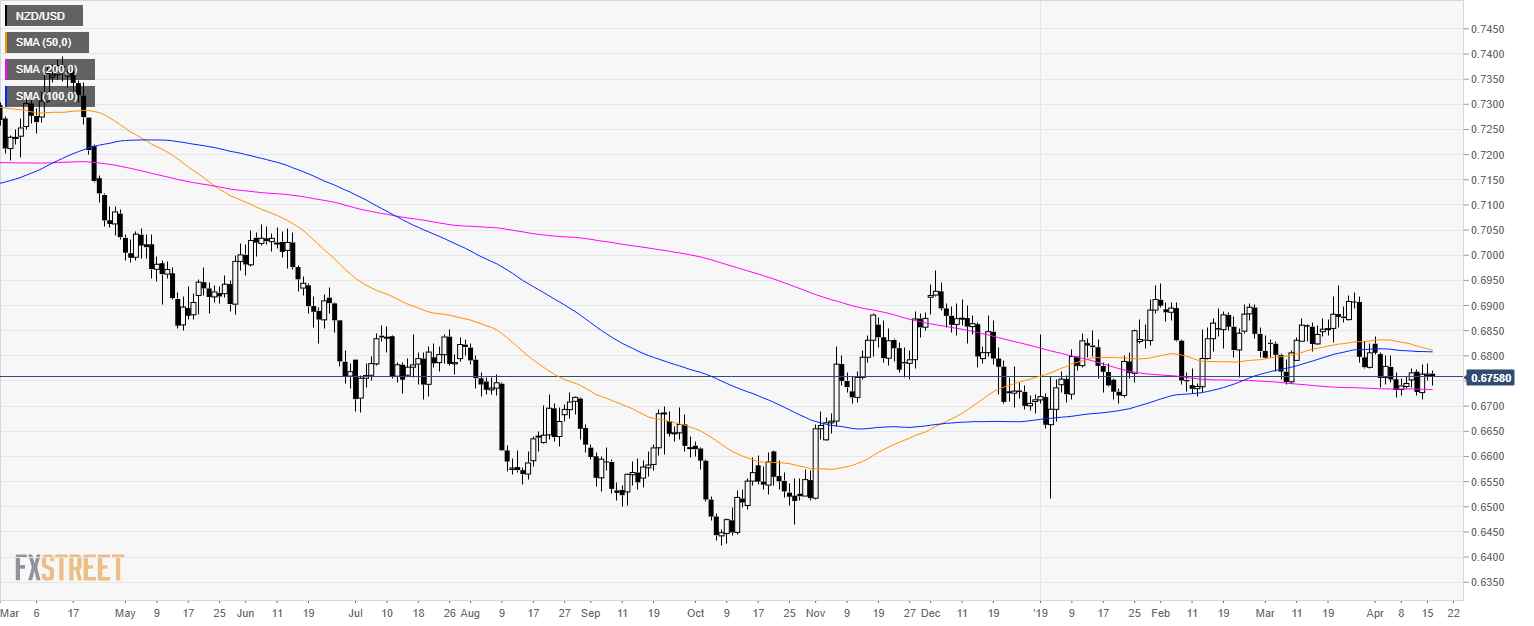
NZD/USD daily chart
- NZD/USD is trading in a range below its 200-day simple moving average (SMA).
- The New Zealand Consumer Price Index (CPI) year-on-year for the first quarter is scheduled at 22.45 GMT. The event can potentially lead to high volatility in NZD-related pairs.
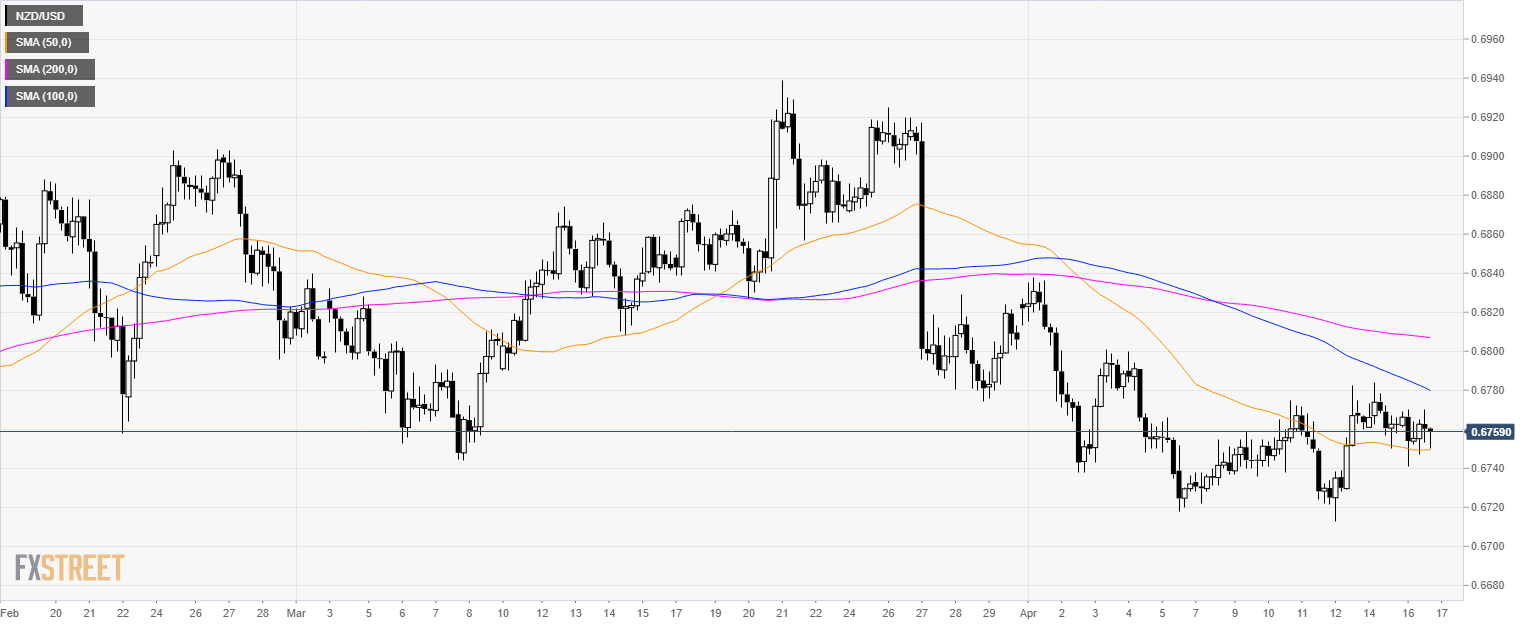
NZD/USD 4-hour chart
- NZD/USD is trading above its 50 SMA suggesting a consolidation in the medium-term.
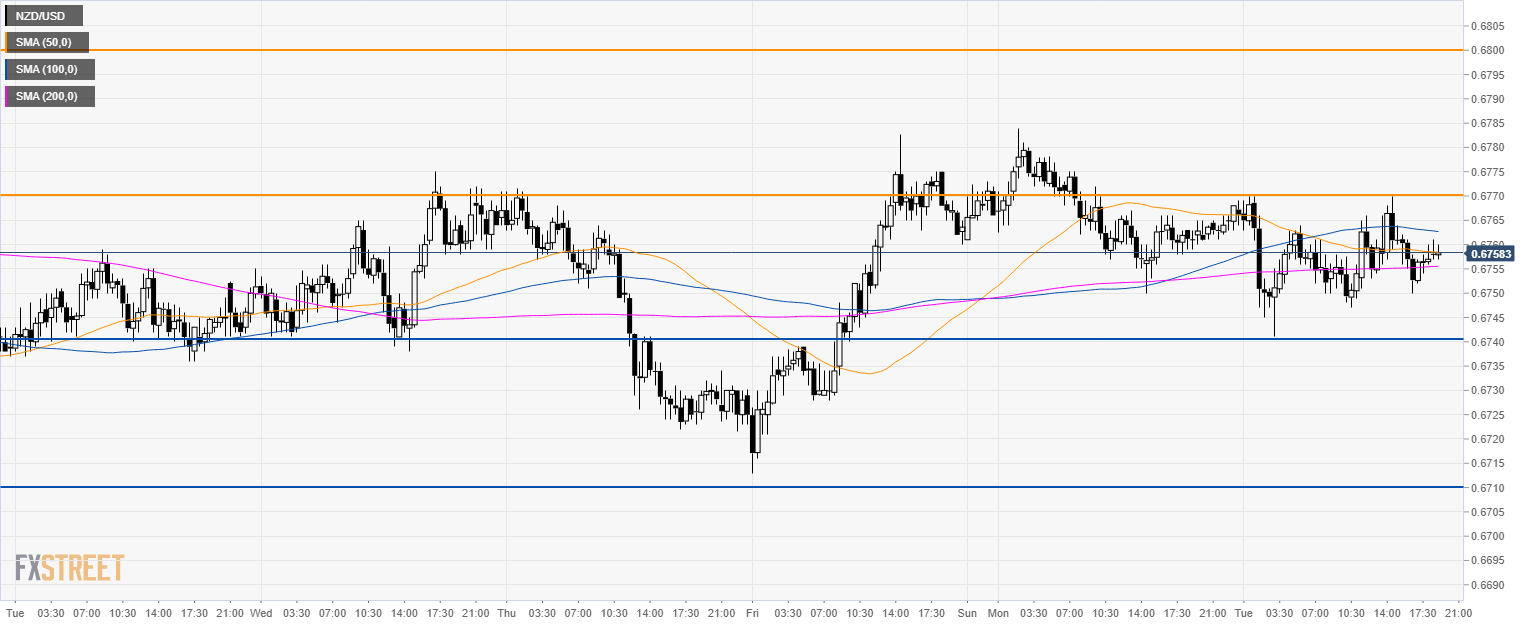
NZD/USD 30-minute chart
- NZD/USD is consolidating above its 200 SMA this Tuesday.
- Bulls need a break above 0.6770 to reach 0.6800 figure to the upside.
- Support is at 0.6740 and 0.6710 level.
Additional key levels
