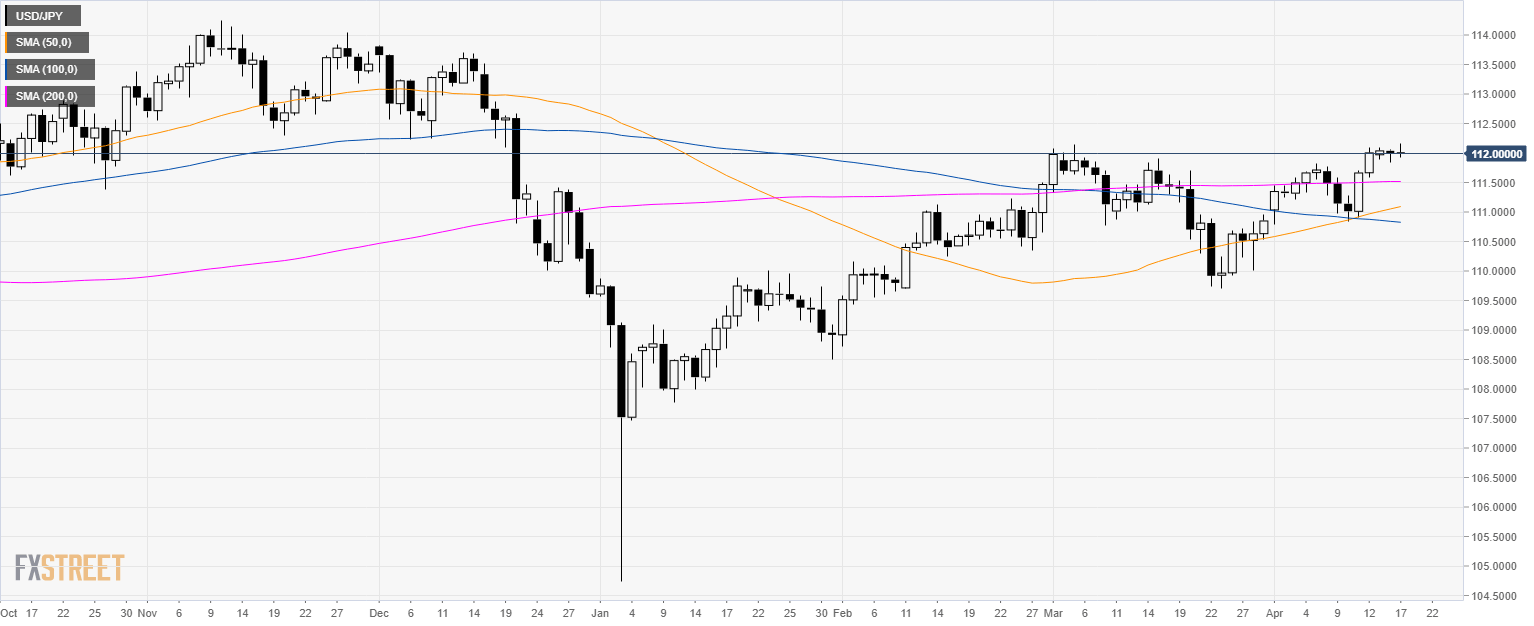
USD/JPY daily chart
- USD/JPY is trading above its 200-day simple moving average (SMA).
- The price action this week has been so far choppy but the dominant trend remains bullish.
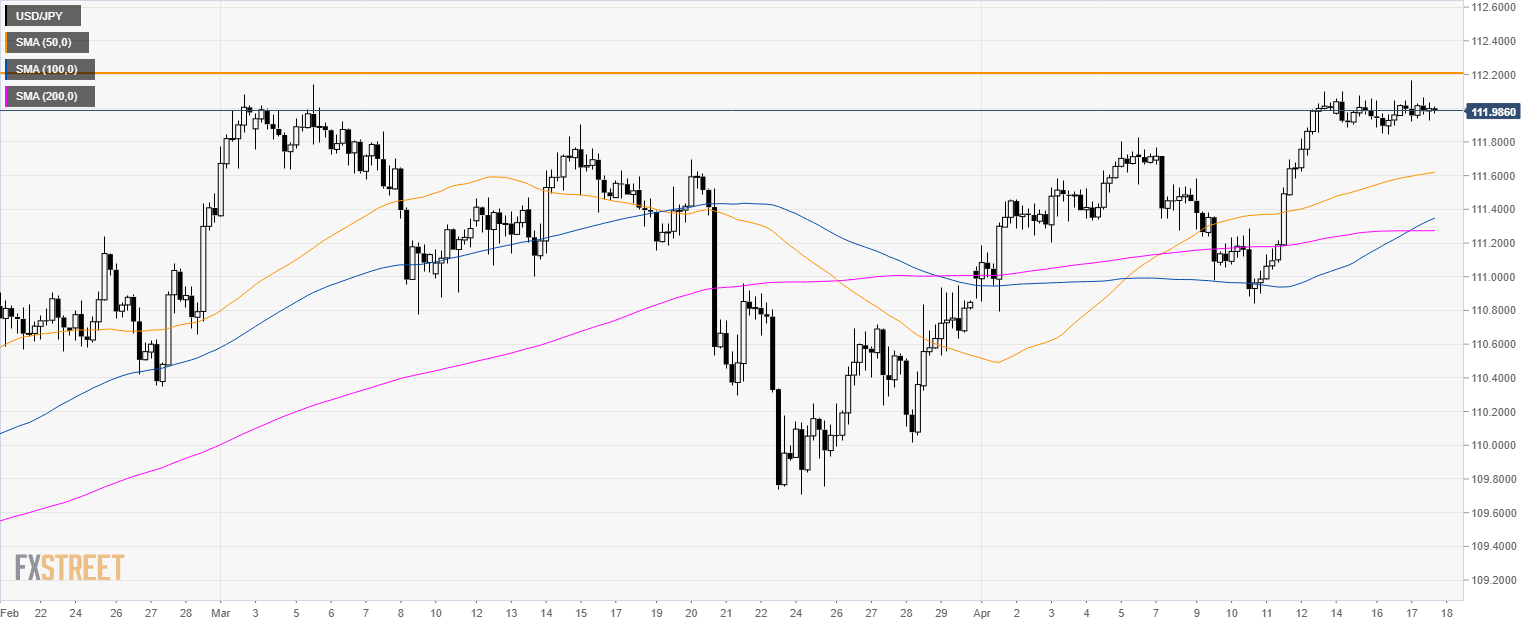
USD/JPY 4-hour chart
- The level to beat for bulls is 112.20 key resistance.
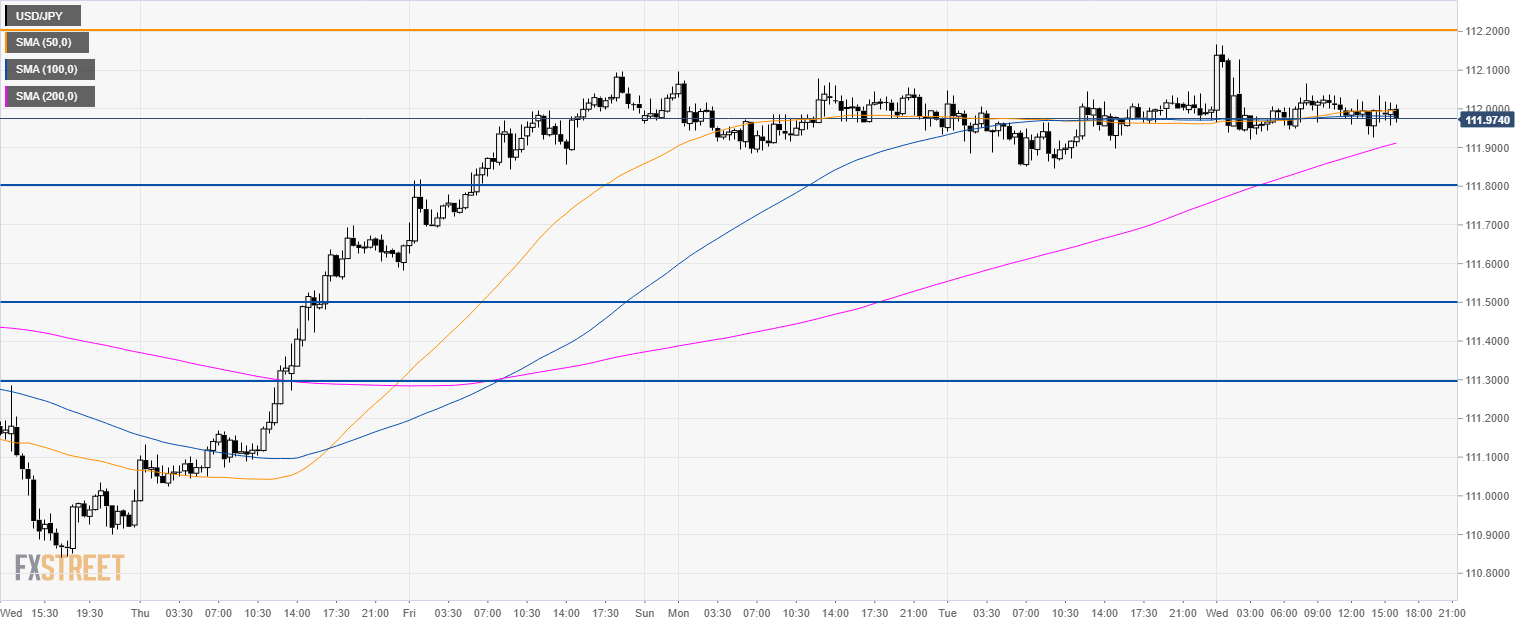
USD/JPY 30-minute chart
- USD/JPY is trading above its 200 SMA and near a flat 50 and 100 SMA suggesting a bullish bias in the short-term.
- USD/JPY bulls would need a break above 112.20 to travel to 112.50 and 113.00 resistance.
- To the downside, support is seen at 111.80 and 111.50 level.
Additional key levels
