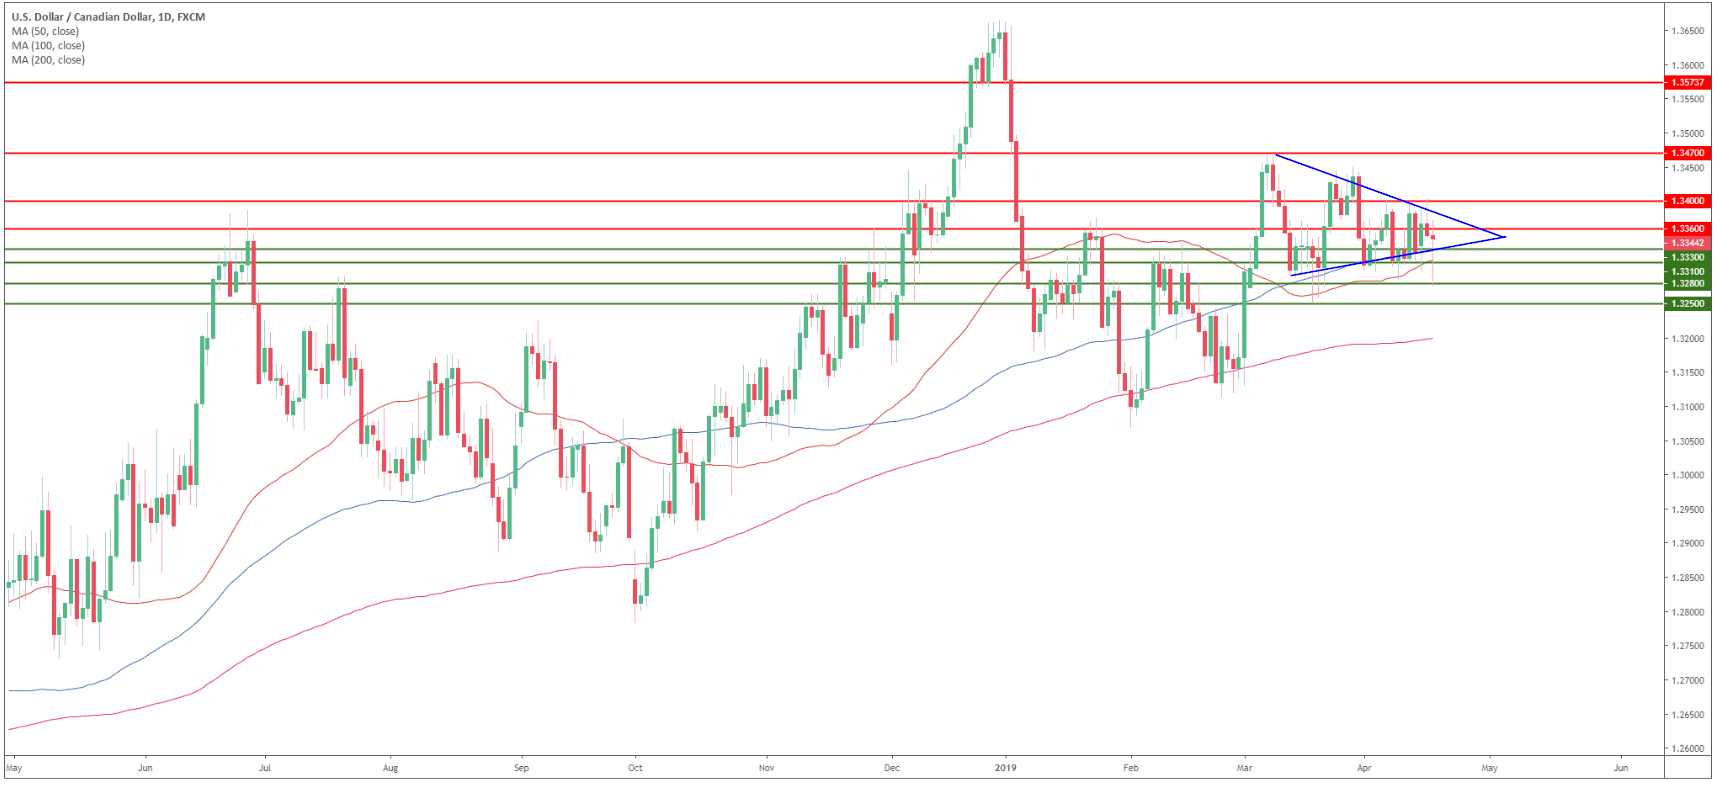
USD/CAD daily chart
- USD/CAD is trading in a bull trend above its 200 simple moving average (SMA).
- The Loonie formed a triangle pattern.
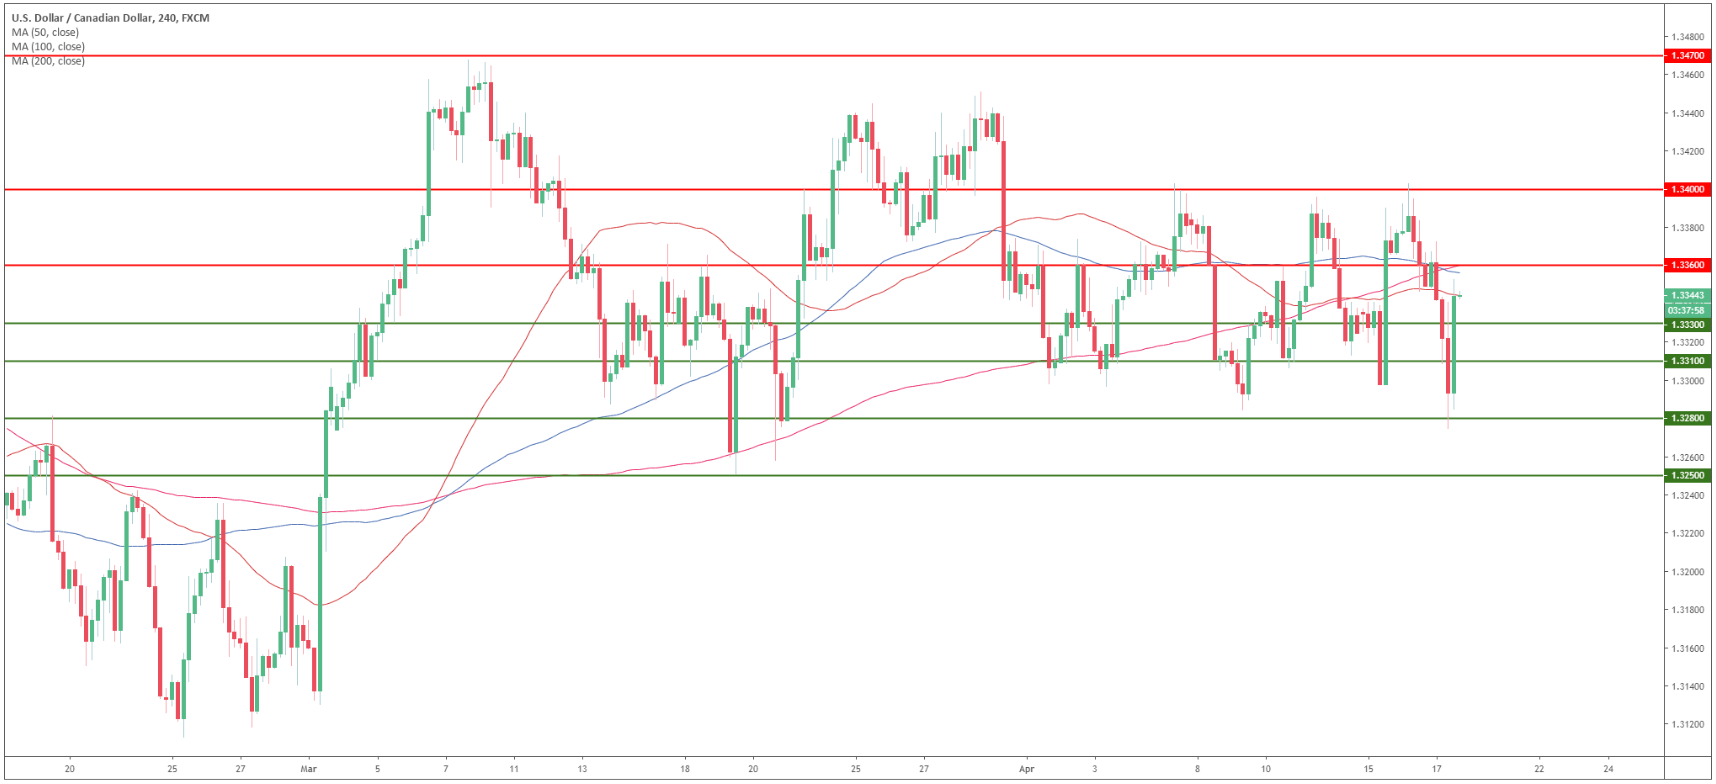
USD/CAD 4-hour chart
- USD/CAD is finding some resistance below 1.3360 and the 50 SMA.
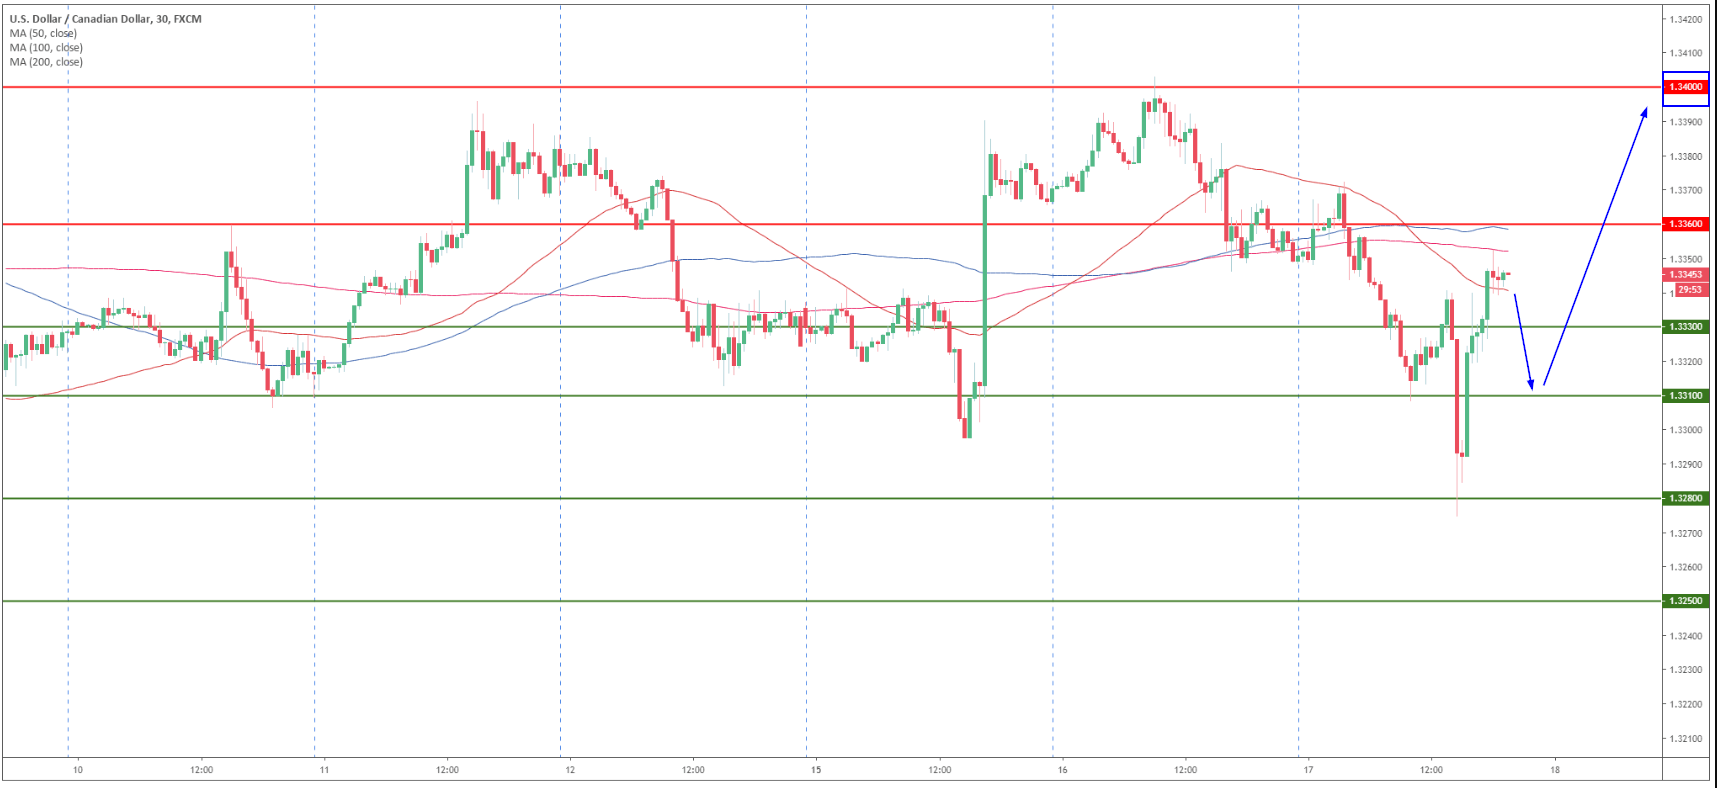
USD/CAD 30-minute chart
- In the very short-term USD/CAD is seen declining towards 1.3330/10 where the market can potentially find buying interest.
- The 1.3360 and 1.3400 level remain in play for bulls in the coming sessions.
Additional key levels
