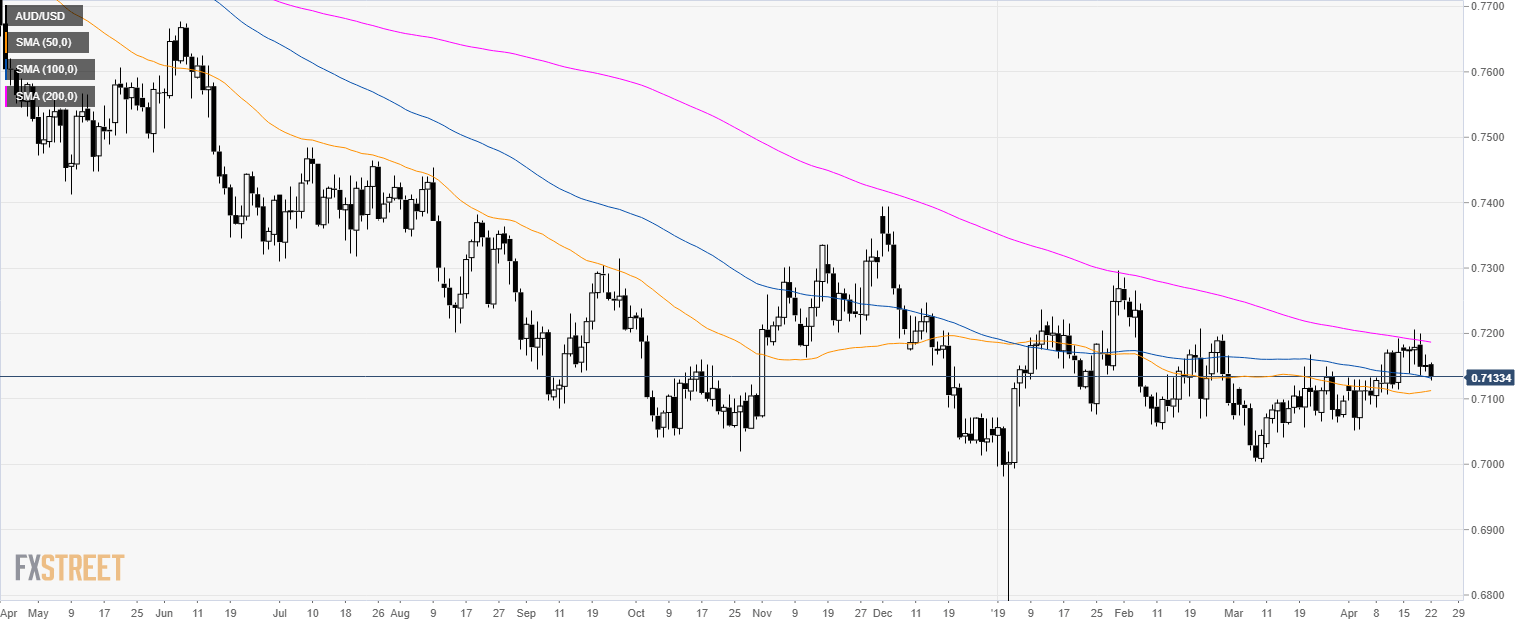
AUD/USD daily chart
- AUD/USD is trading in a bear trend below its 200-day simple moving averages (SMA).
- AUD/USD is trading above the 0.7100 mark and the 50 and 100 SMA. All-in-all suggesting a mixed picture for the currency pair.
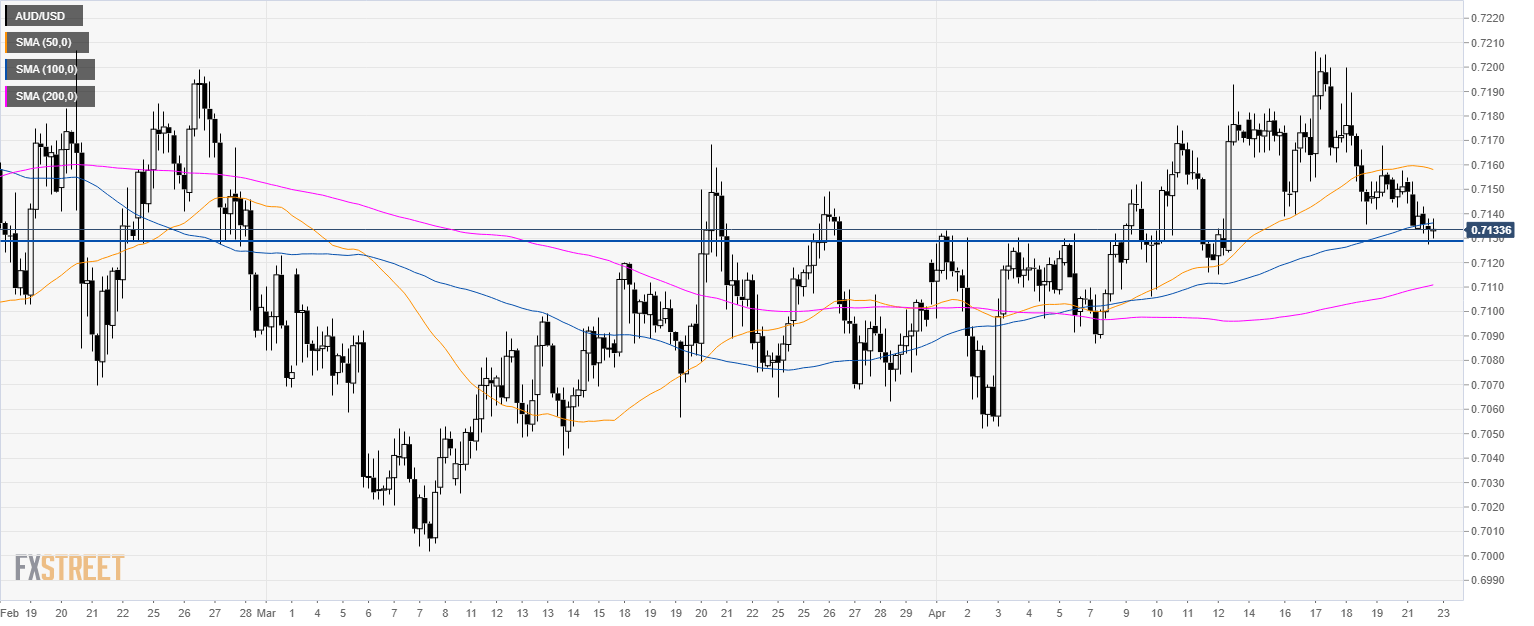
AUD/USD 4-hour chart
- AUD/USD is dropping below the 50 and 100 SMAs but is still holding above the 200 SMA and the 0.7130 support level.
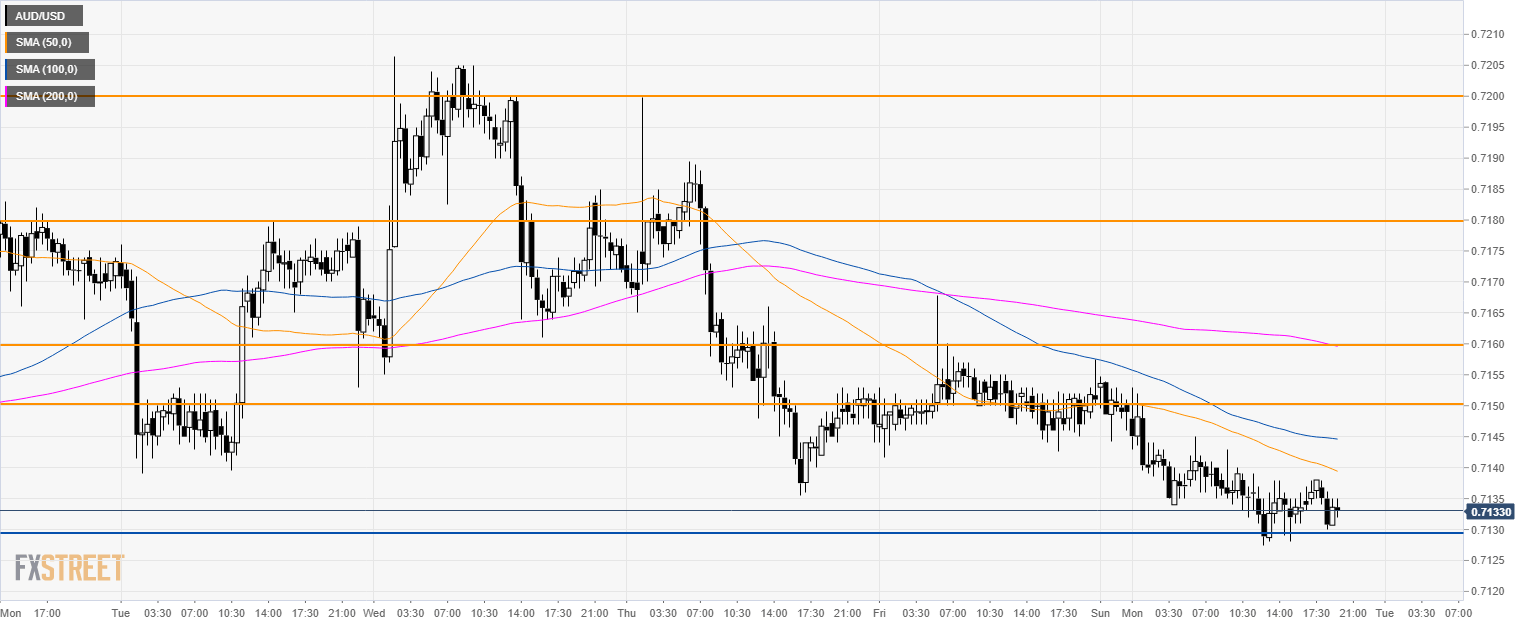
AUD/USD 30-minute chart
- As AUD/USD found some support near 0.7130 bulls can try to drive the markets towards 0.7150/60 and 0.7180 if they gather enough steam.
- A break below 0.7130 could lead to a spike down to 0.7100 figure.
Additional key levels
