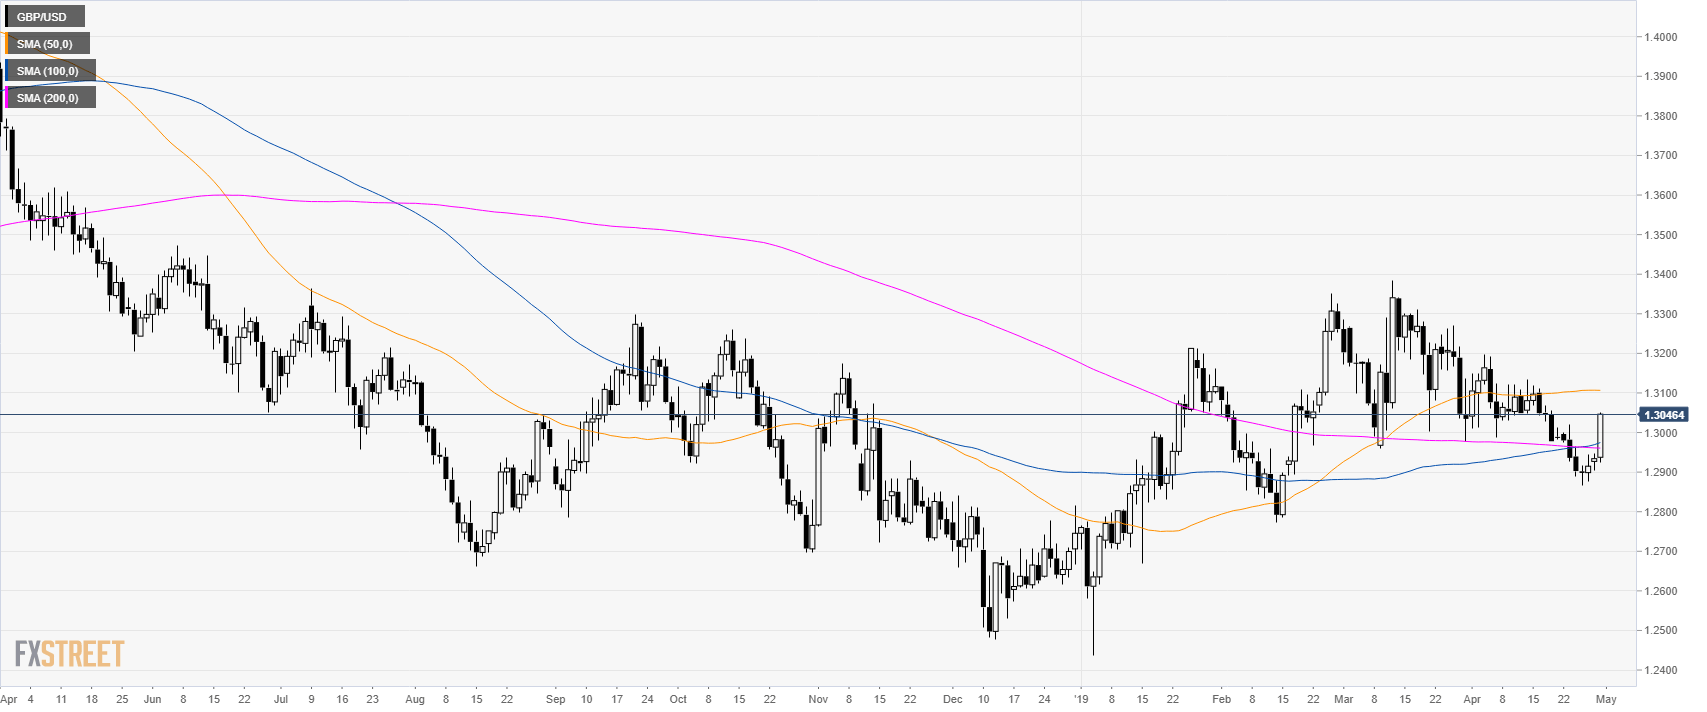
GBP/USD daily chart
- GBP/USD is trading above its 100 and 200 SMAs as the market gets a strong boost above 1.3000 figure.
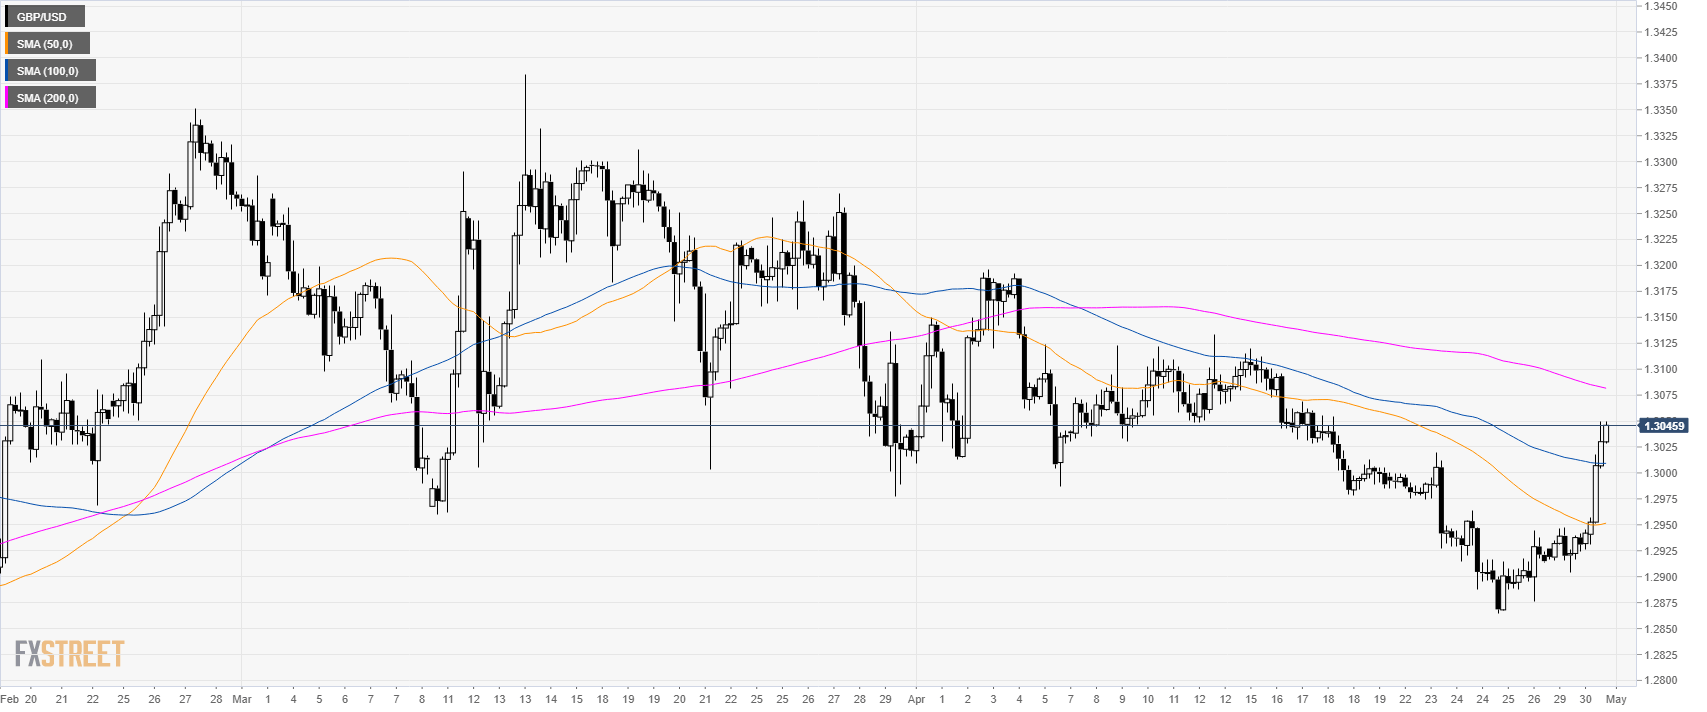
GBP/USD 4-hour chart
- GBP/USD is trading above the 50 and 100 SMAs suggesting consolidation up in the medium-term.
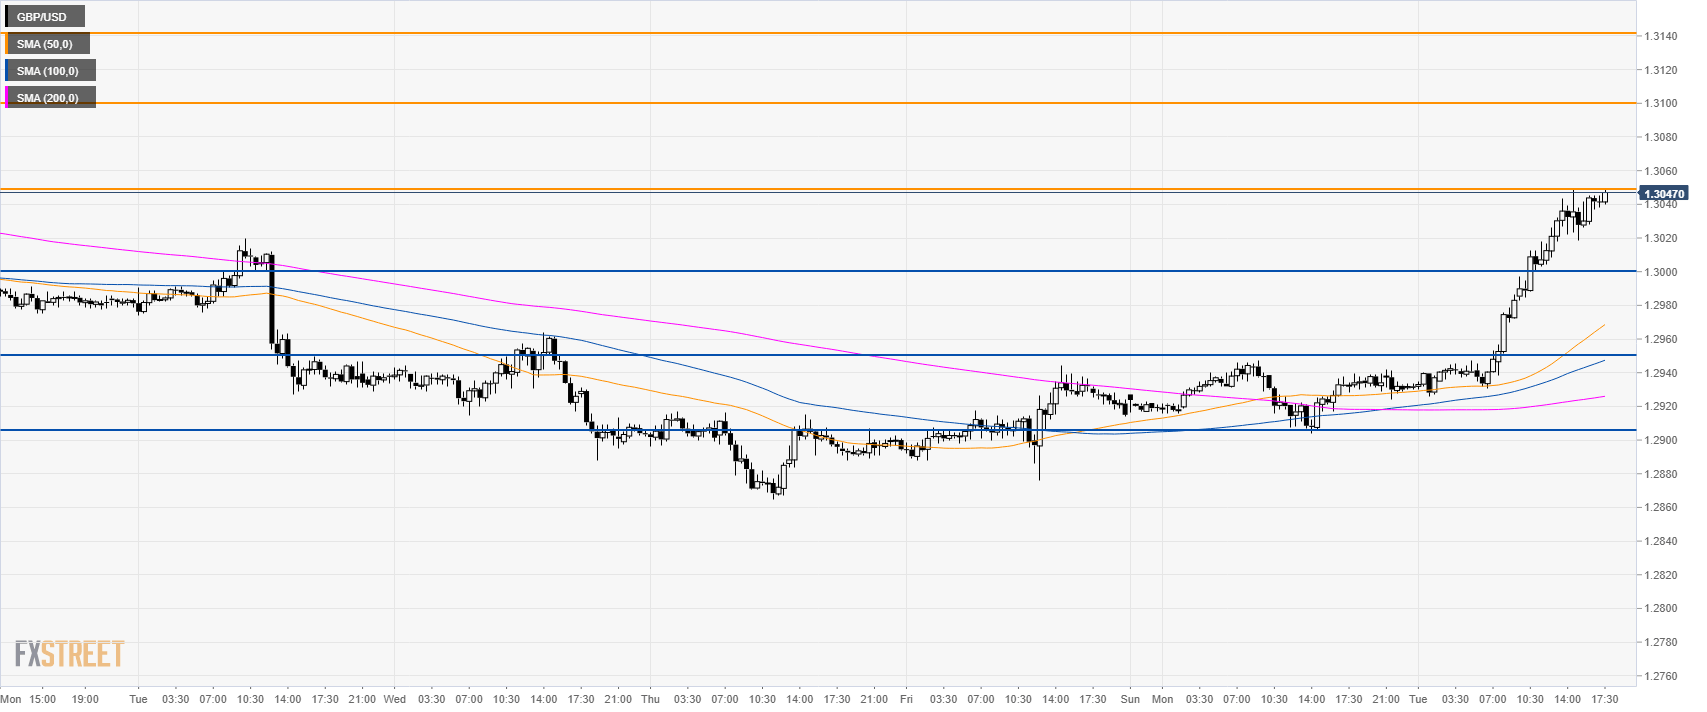
GBP/USD 30-minute chart
- GBP/USD is trading above its main SMAs suggesting a bullish bias in the short-term.
- If bulls break 1.3050 then 1.3100 and 1.3140 can become the next targets.
- Support is at 1.3000 and 1.2950 level.
Additional key levels
