- Extended support break signals further downside unless clearing $64.80.
- 200-day SMA acts as nearby strong rest-point.
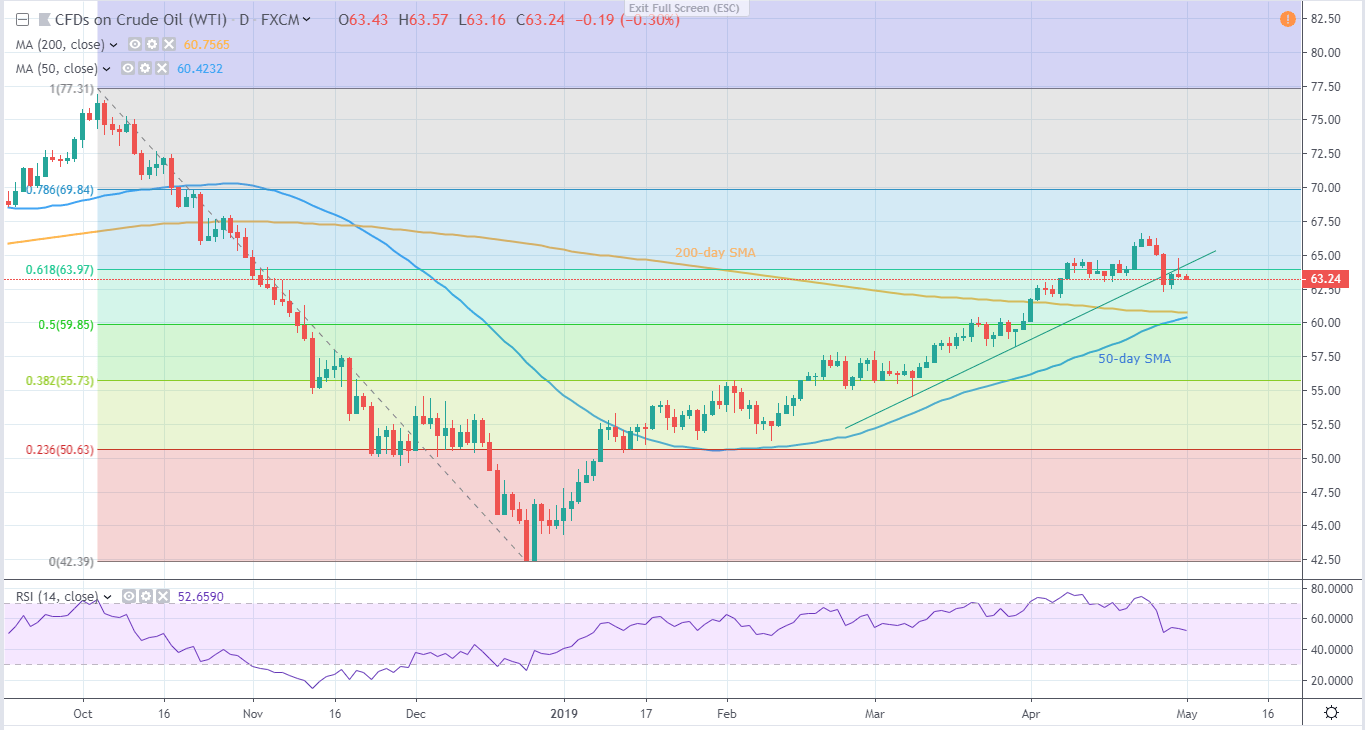
Failure to sustain early-week bounce continues to drag WTI beneath nine-week-old ascending trend-line during initial Wednesday.
The energy benchmark presently trades near $63.30 and signals brighter chances of revisiting 200-day simple moving average (SMA) level of $60.80. However, $61.80/60 region including lows since April 02 may offer intermediate halt amid downside.
In case prices keep trading southwards past-$60.80, 50-day SMA around $60.40 and $60.00 round-figure could flash on sellers’ radar ahead of targeting $58.20 and $57.70 rest-points.
Meanwhile, the support-turned-resistance at $64.80 can continue restricting near-term upside of the black gold, a break of which can recall $65.60 and $66.60 on the chart.
Moreover, successful trading beyond April high could push bulls to aim for $68.00, $69.50 and $70.00 as consecutive landmarks.
WTI daily chart
Trend: Negative
