- Troubles expecting the US-China trade deal drag the quote towards fresh 4-month lows.
- RSI weakness may limit further downside.
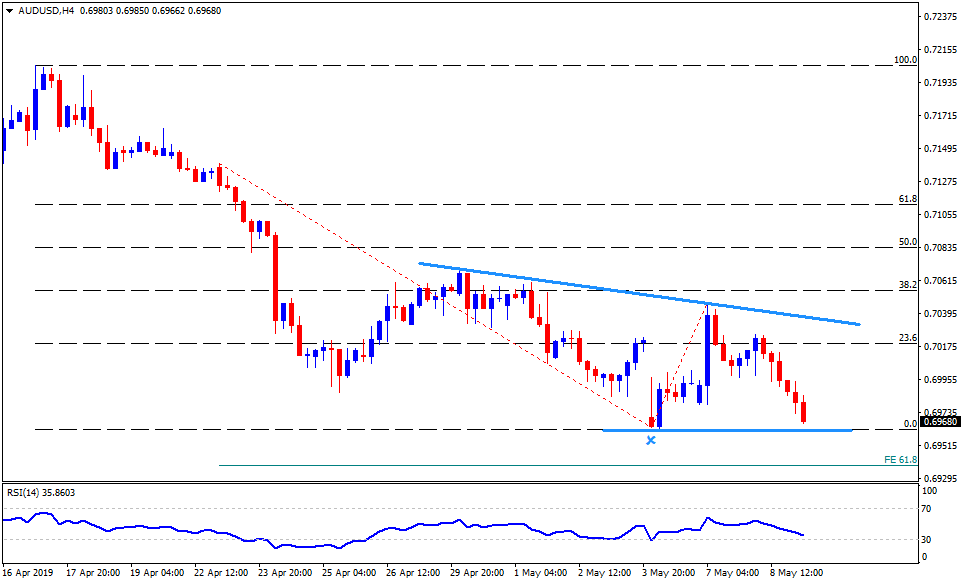
AUD/USD is on the rounds near 0.6970 while heading into the European session on Thursday. While pessimism surrounding the trade negotiations between the US and China is likely dragging the quote to current month lows surrounding 0.6960, RSI weakness may trigger another U-turn from the support.
Give the prices ignore the weakness of 14-bar relative strength index (RSI) on 4-hour chart, the present decline can extend towards 61.8% Fibonacci expansion (FE) level of moves since April 23, at 0.6940.
However, break of 0.6940 can offer additional strength to the bears as they look to January 2016 levels near 0.6920, 0.6870 and then the year 2016 bottoms around 0.6820.
Meanwhile, 0.7000 acts as immediate upside resistance, a break of which could escalate the recovery to 0.7030 but 10-day long resistance-line at 0.7040 may question further advances.
If at all extra optimism drive the quote beyond 0.7040, April month highs near 0.7070 and 61.8% Fibonacci retracement level near 0.7110 could become bulls’ favorites.
AUD/USD 4-Hour chart
Trend: Pullback expected
