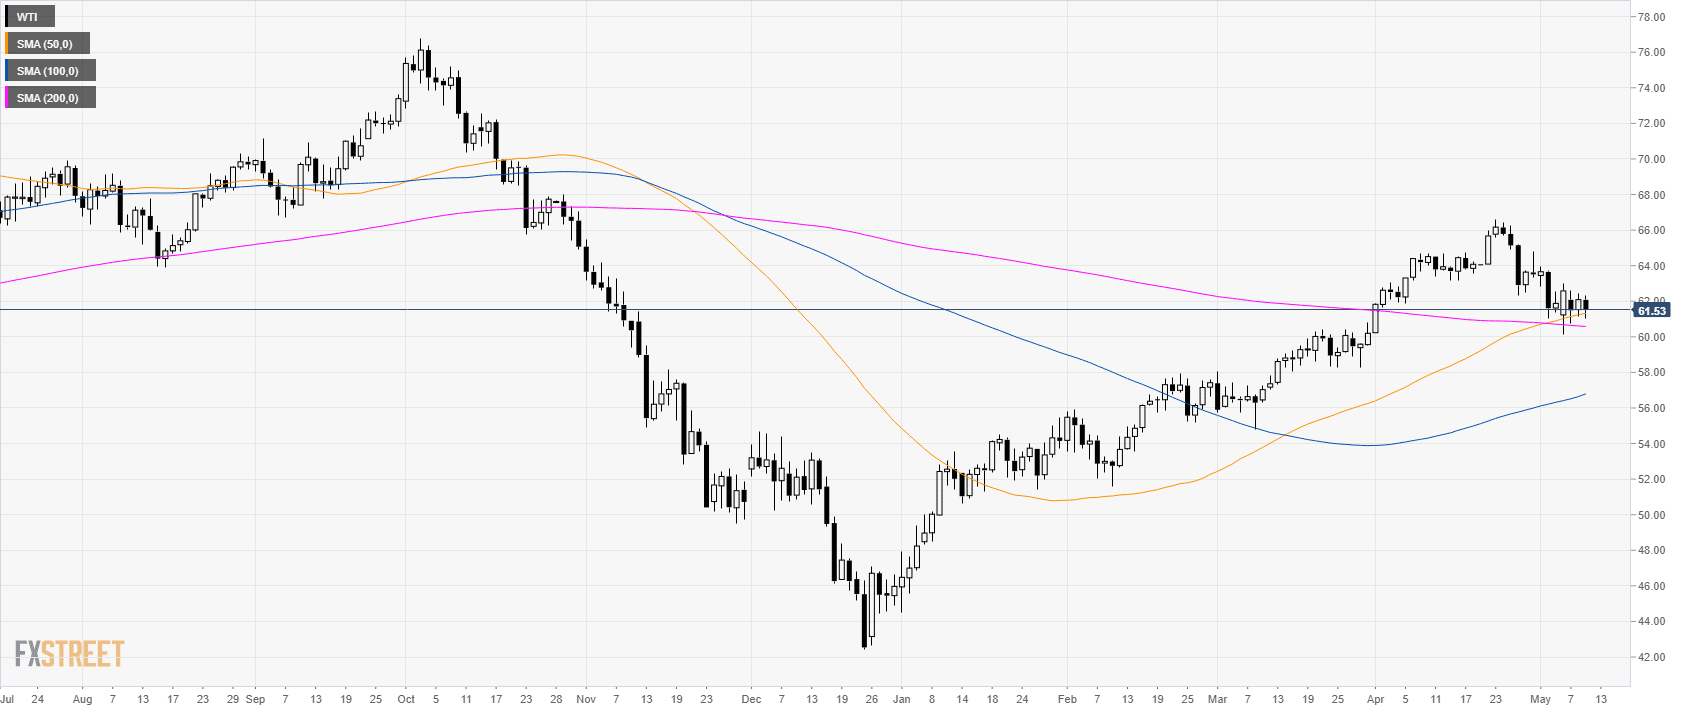
Oil daily chart
WTI (West Texas Intermediate) is trading in a bull trend above its main simple moving averages (SMAs). In the last 5 days, the market has been stabilizing near $61.00 a barrel.
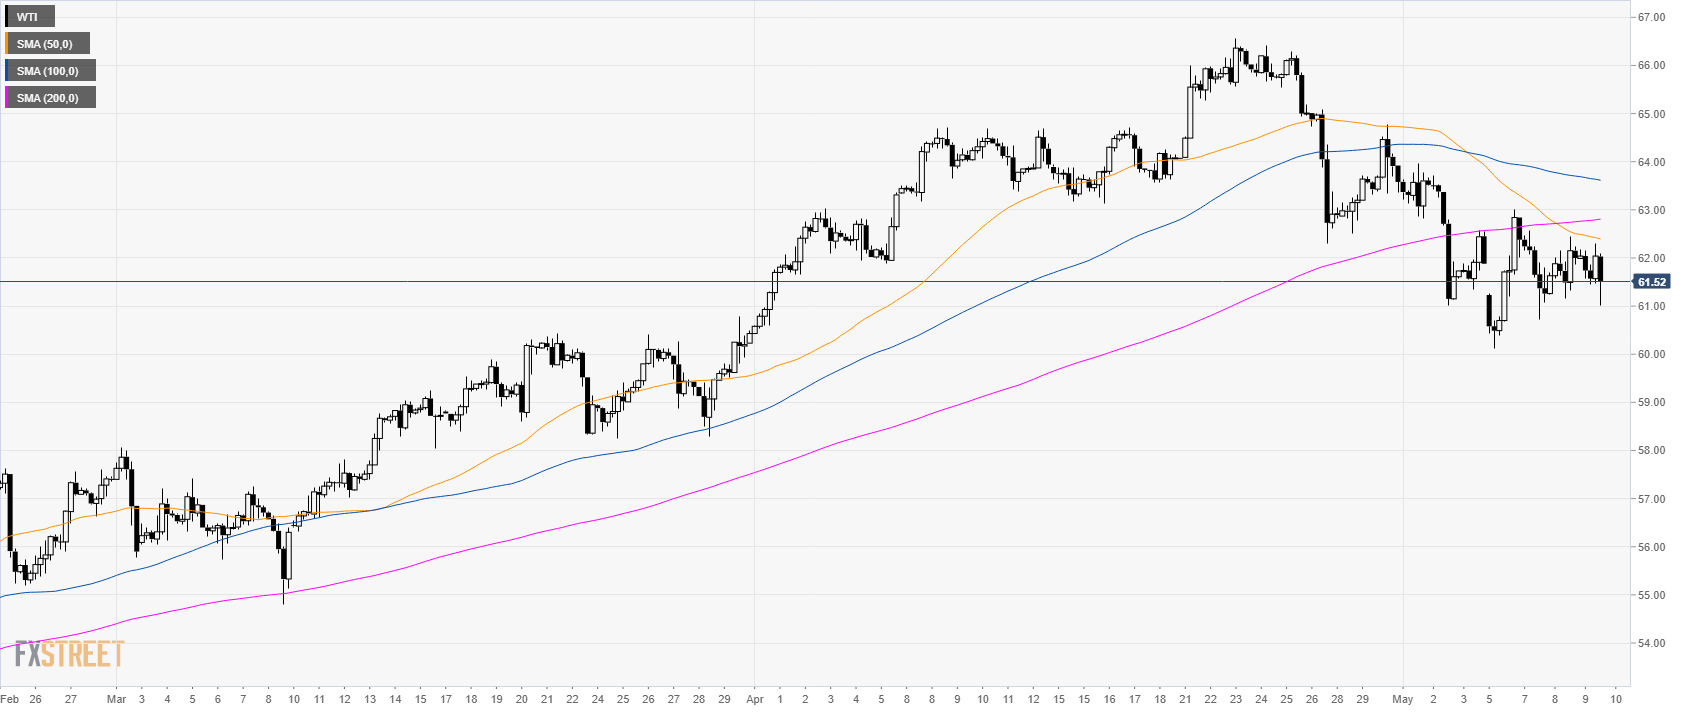
Oil 4-hour chart
WTI is trading below its main SMAs suggesting continued bearish pressure in the medium term.
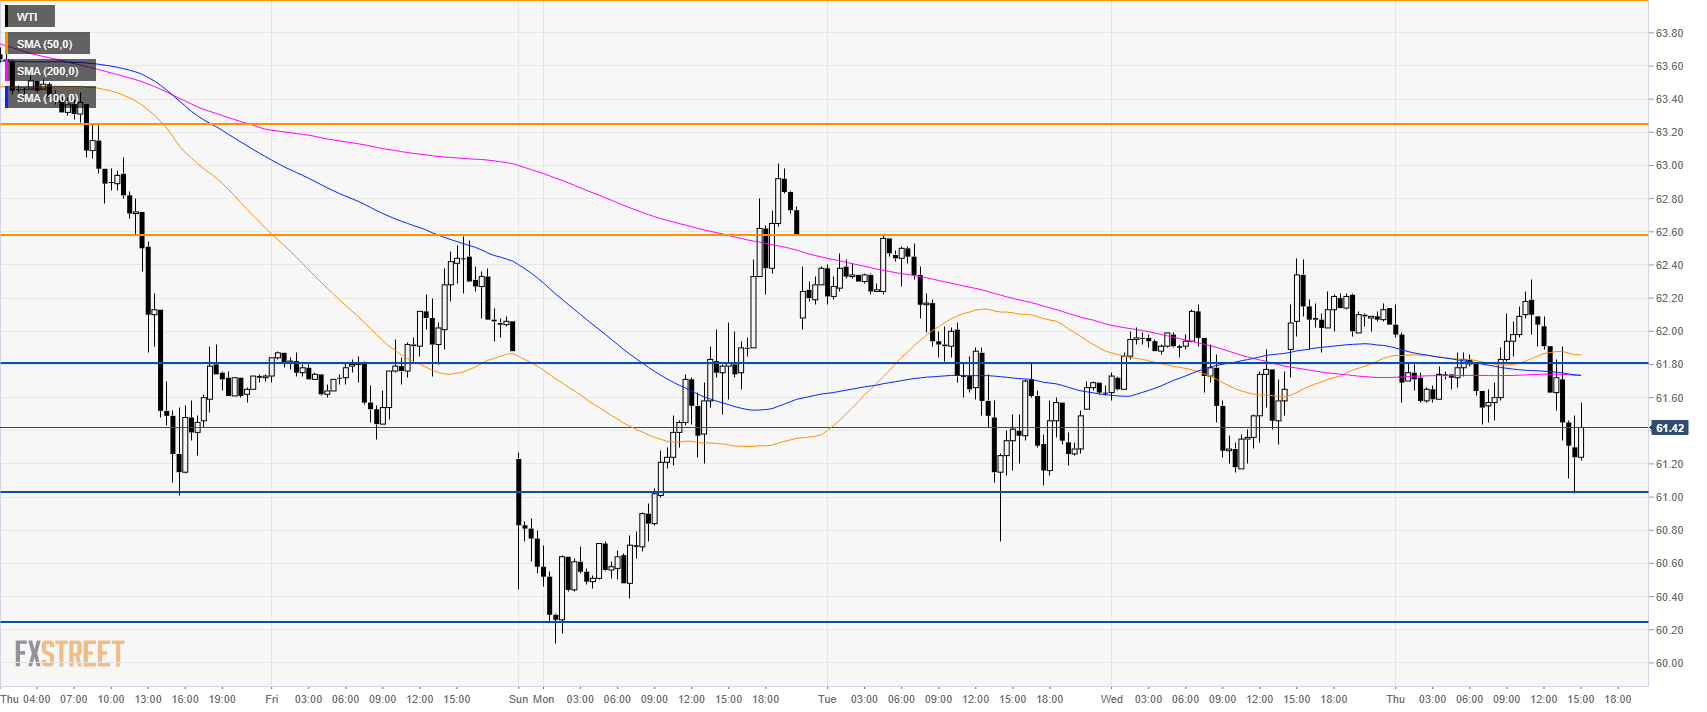
Oil 30-minute chart
WTI has been trading in a range since last Friday.
In order to escape the range, buyers need to break 62.60. After which 63.20 and 64.00 can be the next resistances in sight.
Supports are at 61.00 and 60.20 levels.
Additional key levels
