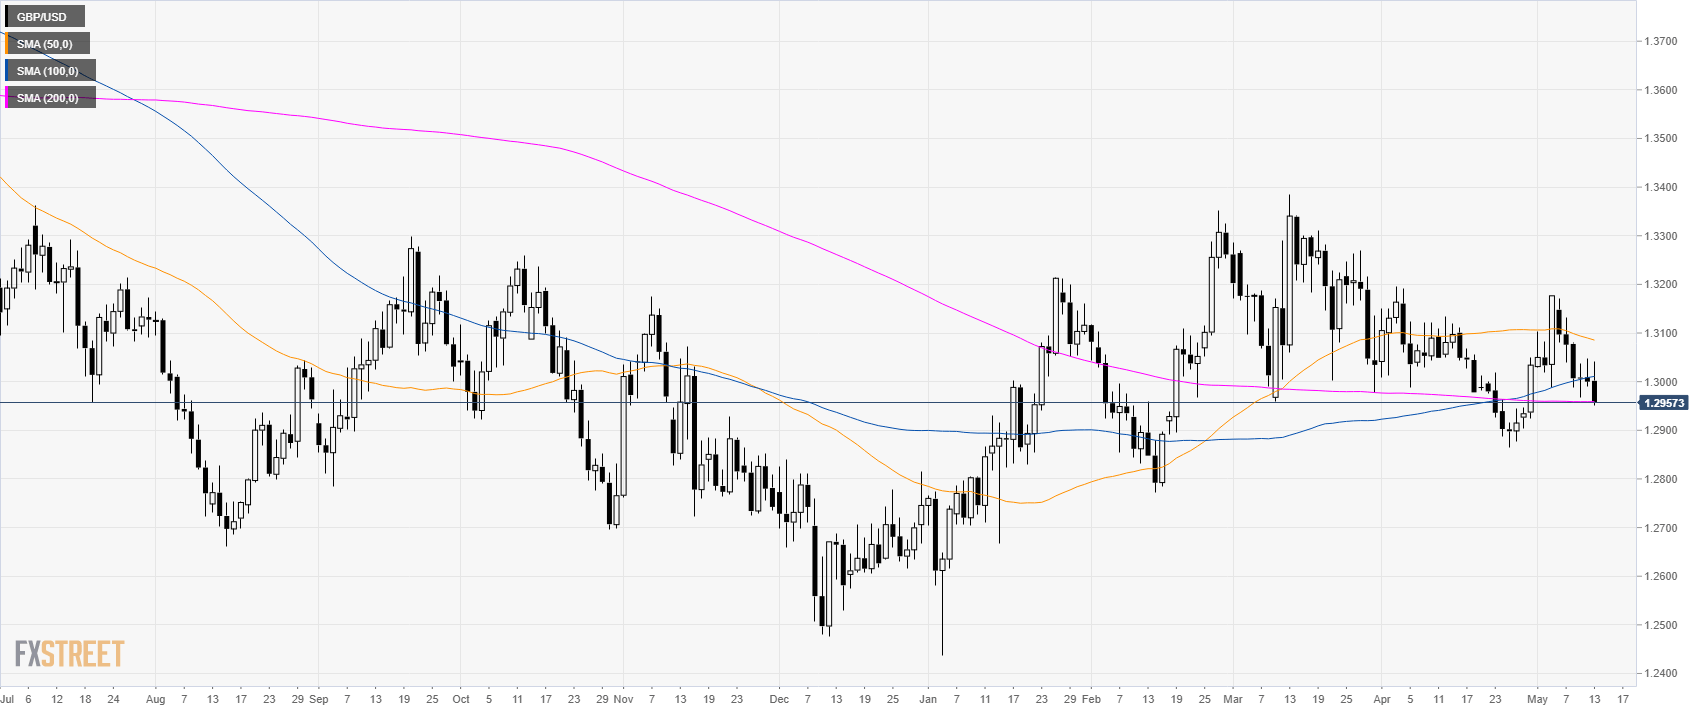
Home GBP/USD technical analysis: Head and shoulder pattern is driving the Cable sharply below 1.3000 figure
FXStreet News

GBP/USD technical analysis: Head and shoulder pattern is driving the Cable sharply below 1.3000 figure

GBP/USD daily chart

GBP/USD is trading  down sharply as bears break the 1.3000 figure.
GBP/USD is trading just near its 200 SMA at 1.2958 level.

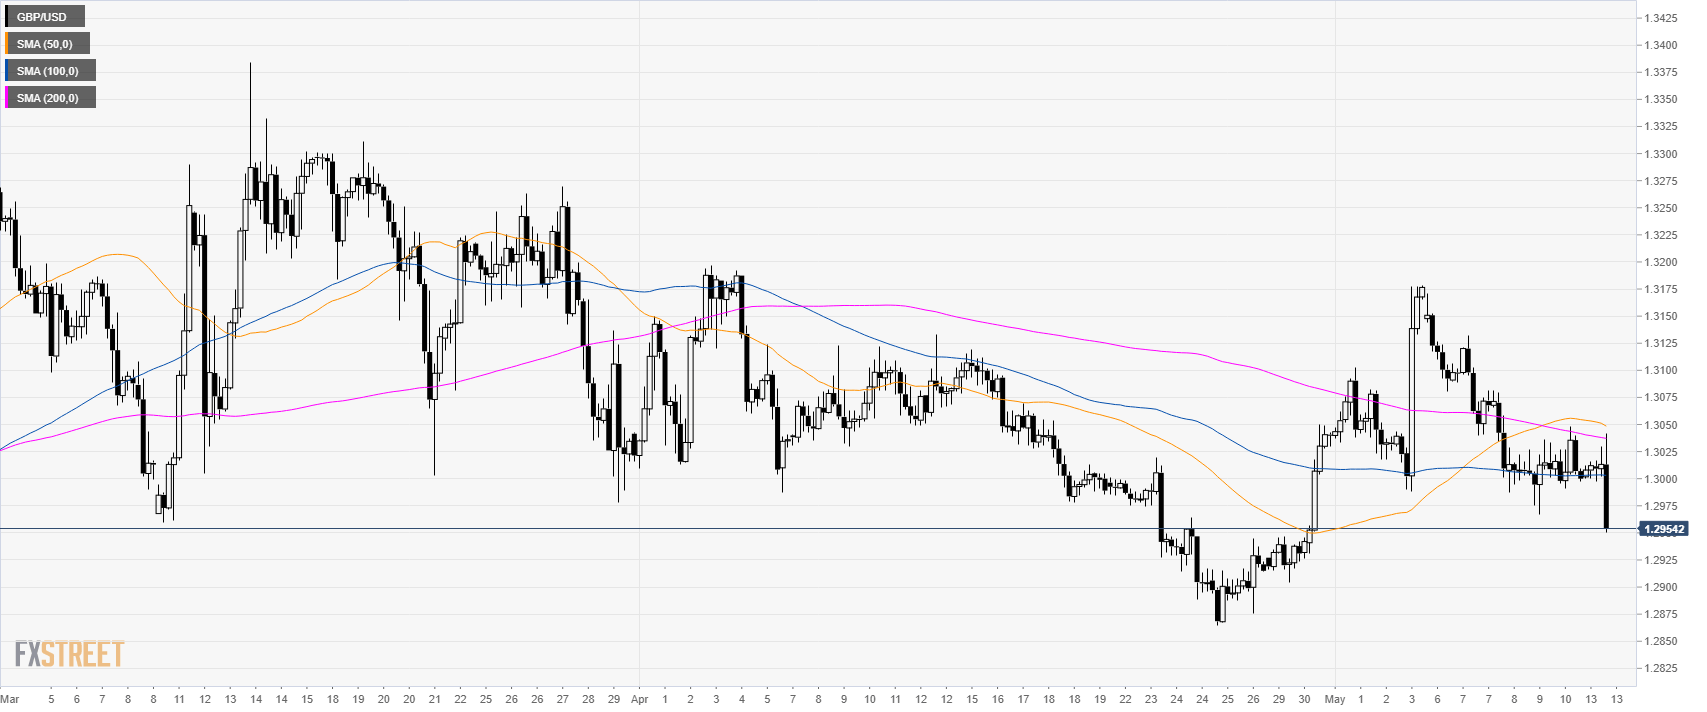
GBP/USD 4-hour chart

Cable formed a head and shoulder pattern sending the currency pair below the 1.3000 figure.


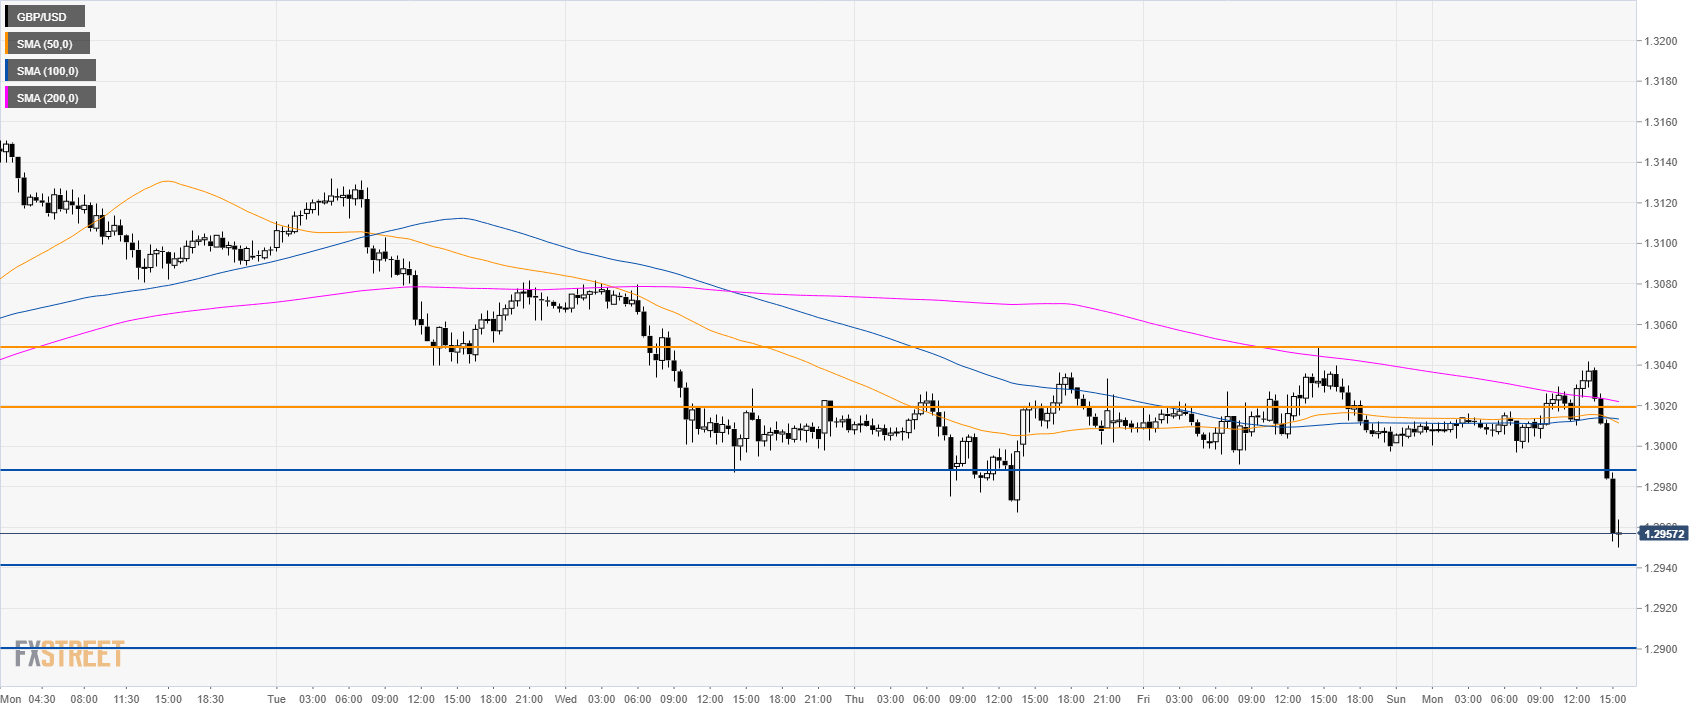
GBP/USD 30-minute chart

The picture worsened considerably as the market is approaching 1.2940 support. A breach below that level can see the 1.2900 figure on the cards for bears.
Resistance is seen at 1.2990 and 1.3020/50 levels.

Additional key levels


FX Street

FX Street

FXStreet is the leading independent portal dedicated to the Foreign Exchange (Forex) market. It was launched in 2000 and the portal has always been proud of their unyielding commitment to provide objective and unbiased information, to enable their users to take better and more confident decisions.