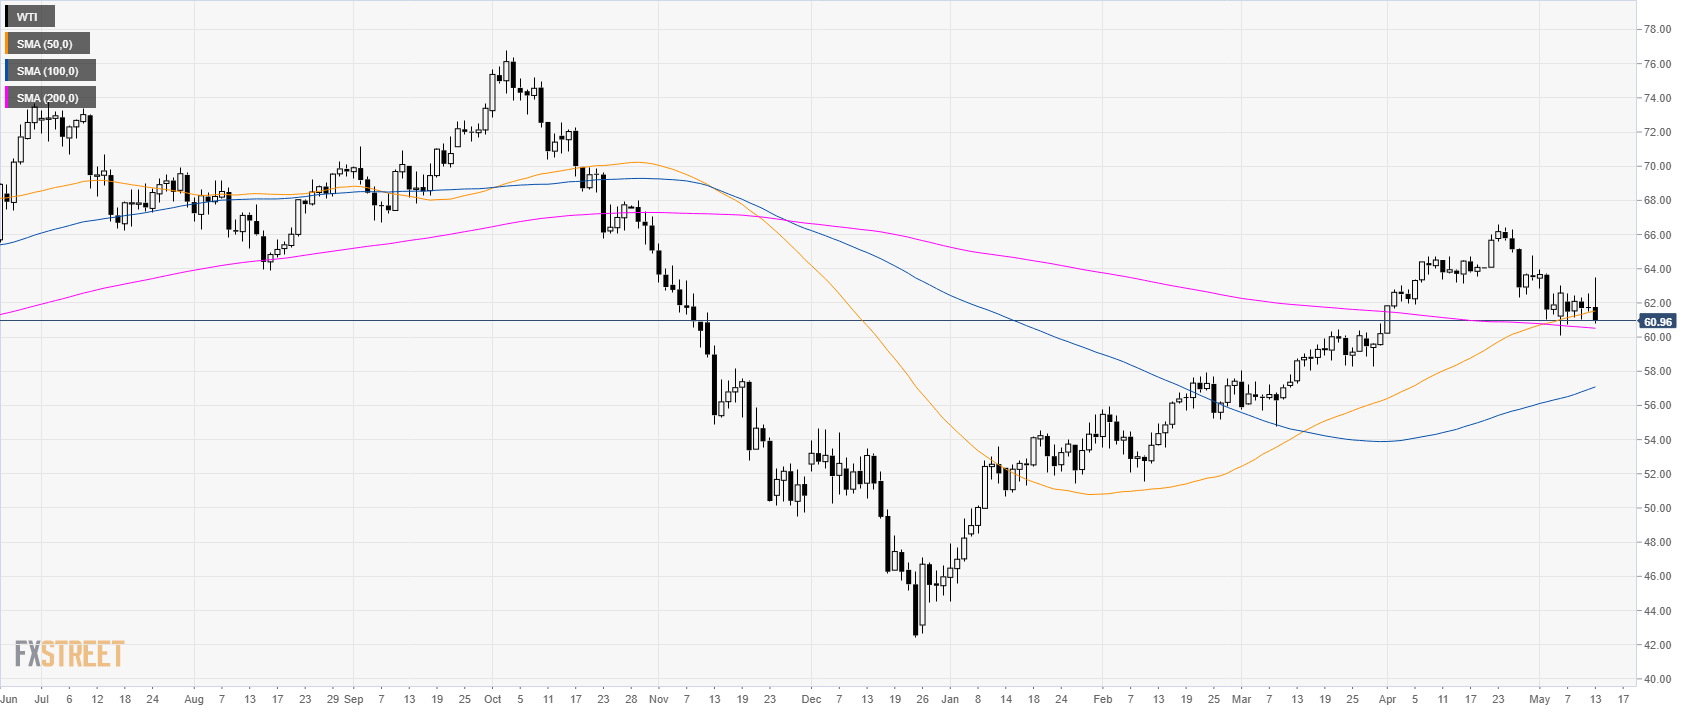
Oil daily chart
WTI (West Texas Intermediate) is retracing from the highs made in April. In the last 7 days, the market has been stabilizing near $61.00 a barrel. However, the overall picture is turning less bullish with the bears now challenging the 200-day simple moving avearges (SMA).
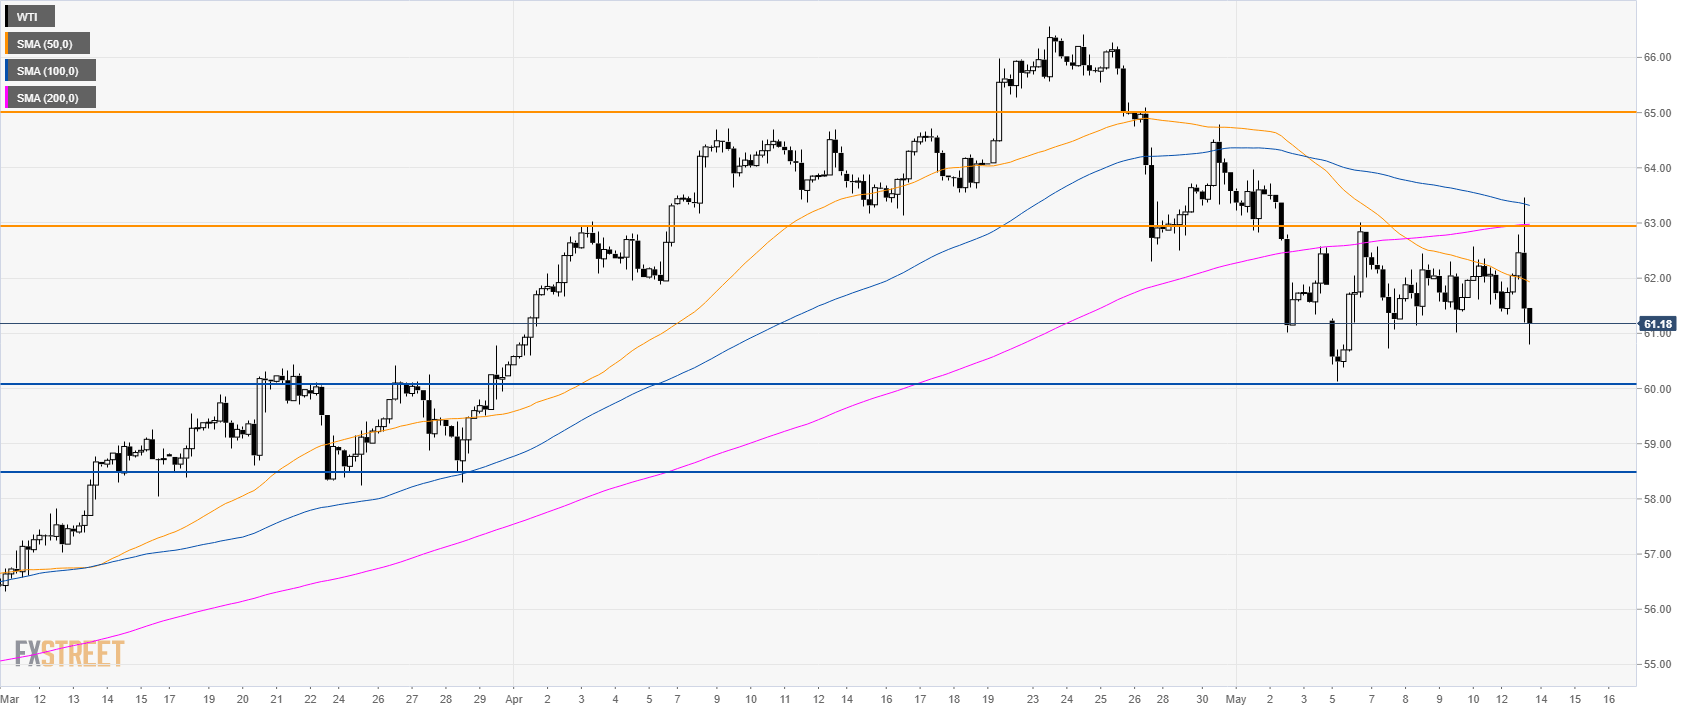
Oil 4-hour chart
WTI is trading below its main SMAs suggesting bearish pressure in the medium term. After an attempt above 63.00, the market collapsed down sharply.
In the coming days/weeks, if bears can break below 60.00 the figure there seems to be little support before the 58.50 level.
Additional key levels
