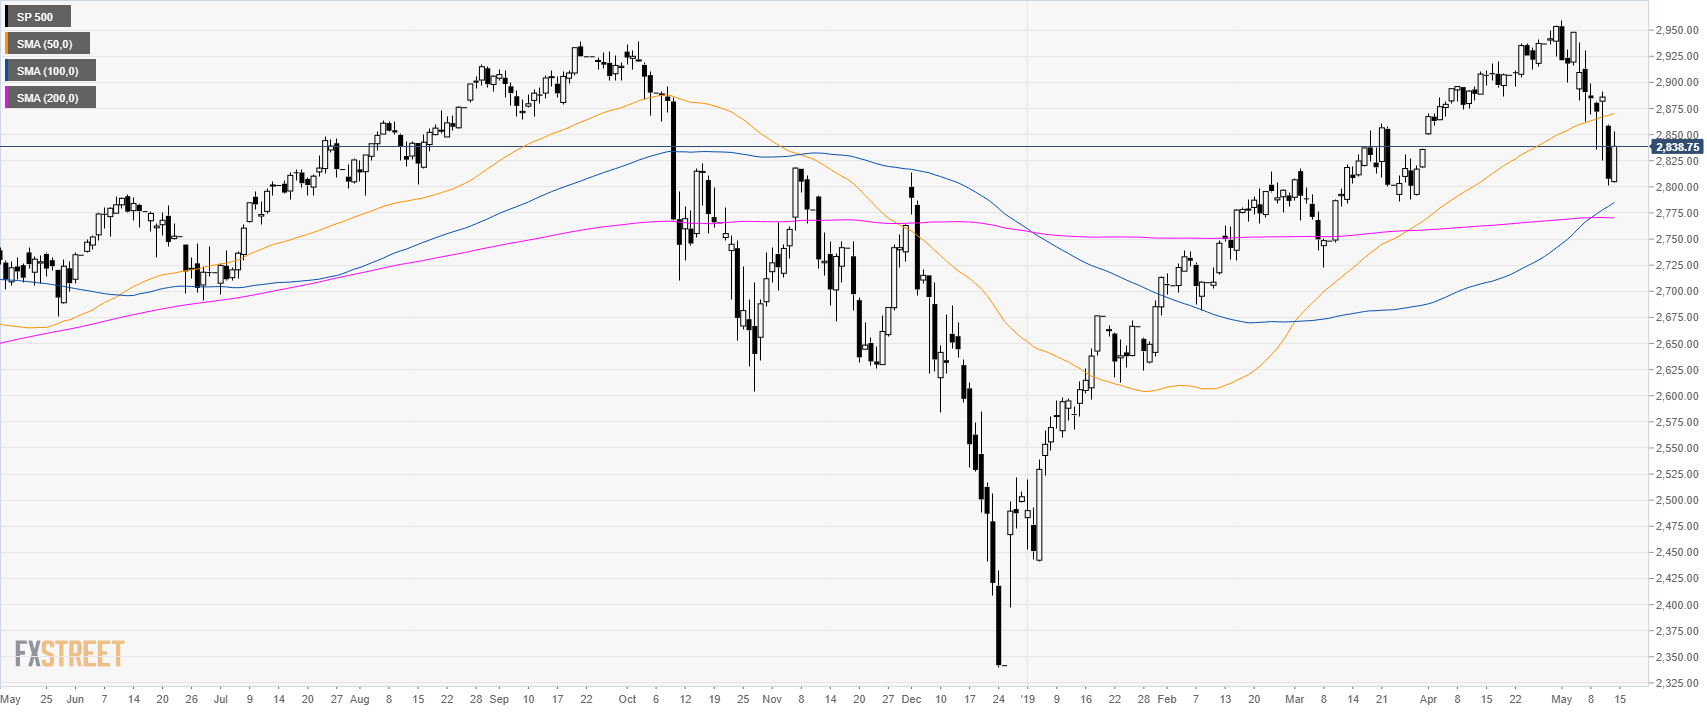
S&P500 daily chart
The S&P500 Index is trading in a bull trend above its 200-period simple moving averages (SMA). The market found some support above the 2,800.00 figure this Tuesday.
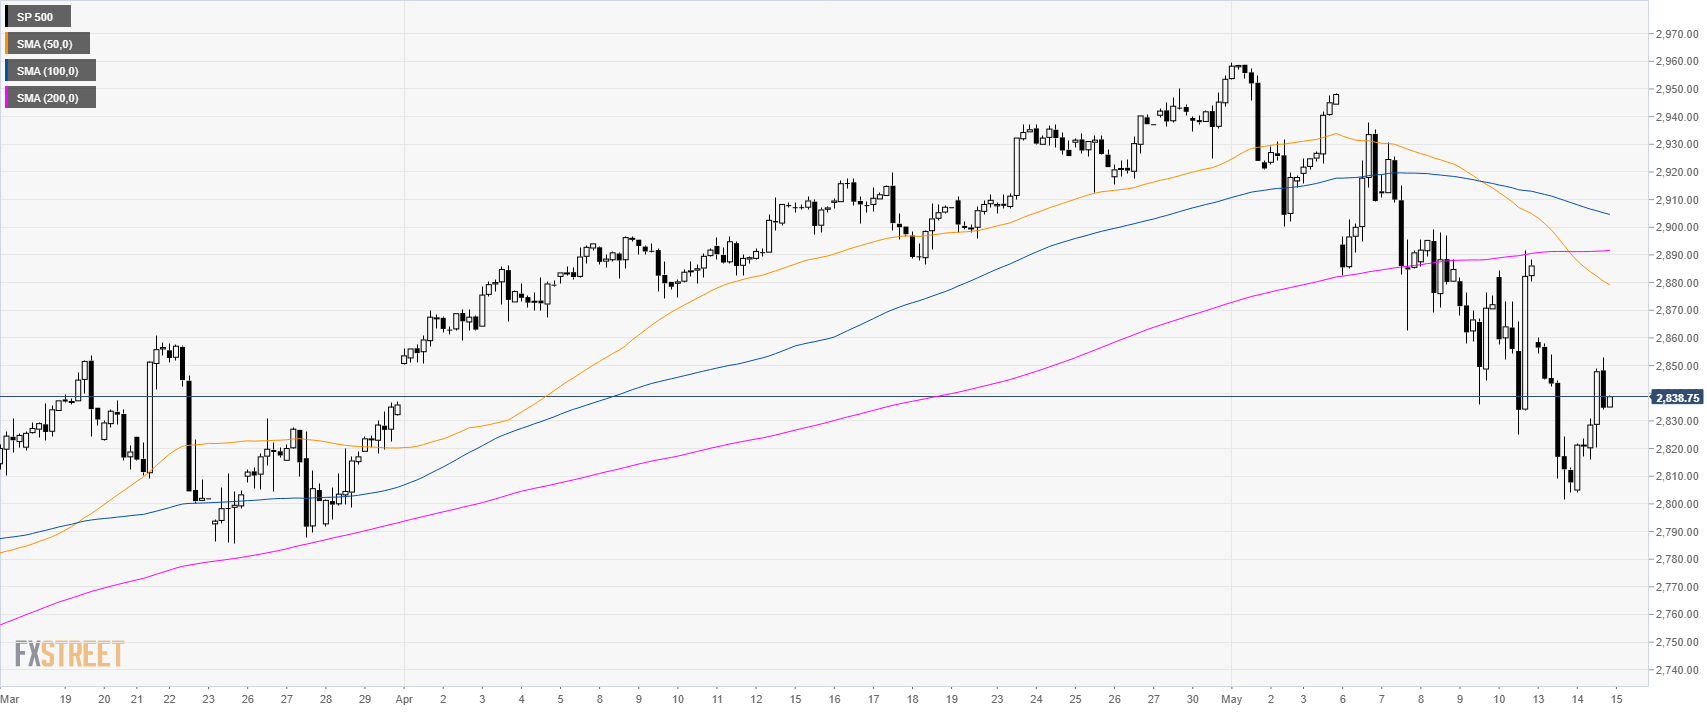
S&P500 4-hour chart
The market is trading below its main SMAs suggesting bearish pressure in the medium term.
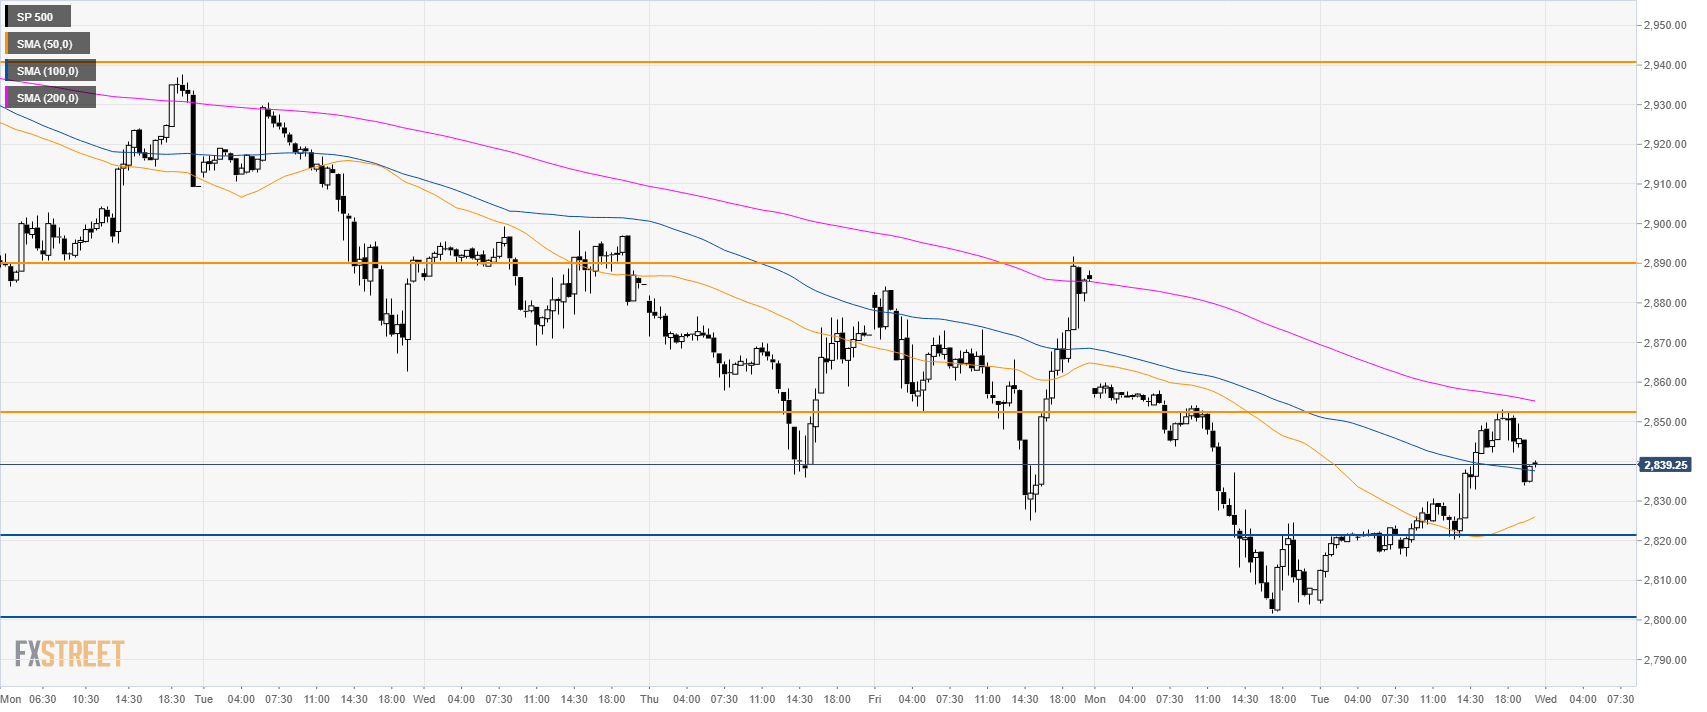
S&P500 30-minute chart
The Index pushed higher throughout the day and is about to close above the 50 and 100 SMA. Bulls seem to be back and they will need to trade beyond 2,853.00 resistance to reach 2,890.00 and 2,940.00 to the upside. Support is at the 2,820.00 and 2,800.00 price level.
Additional key levels
