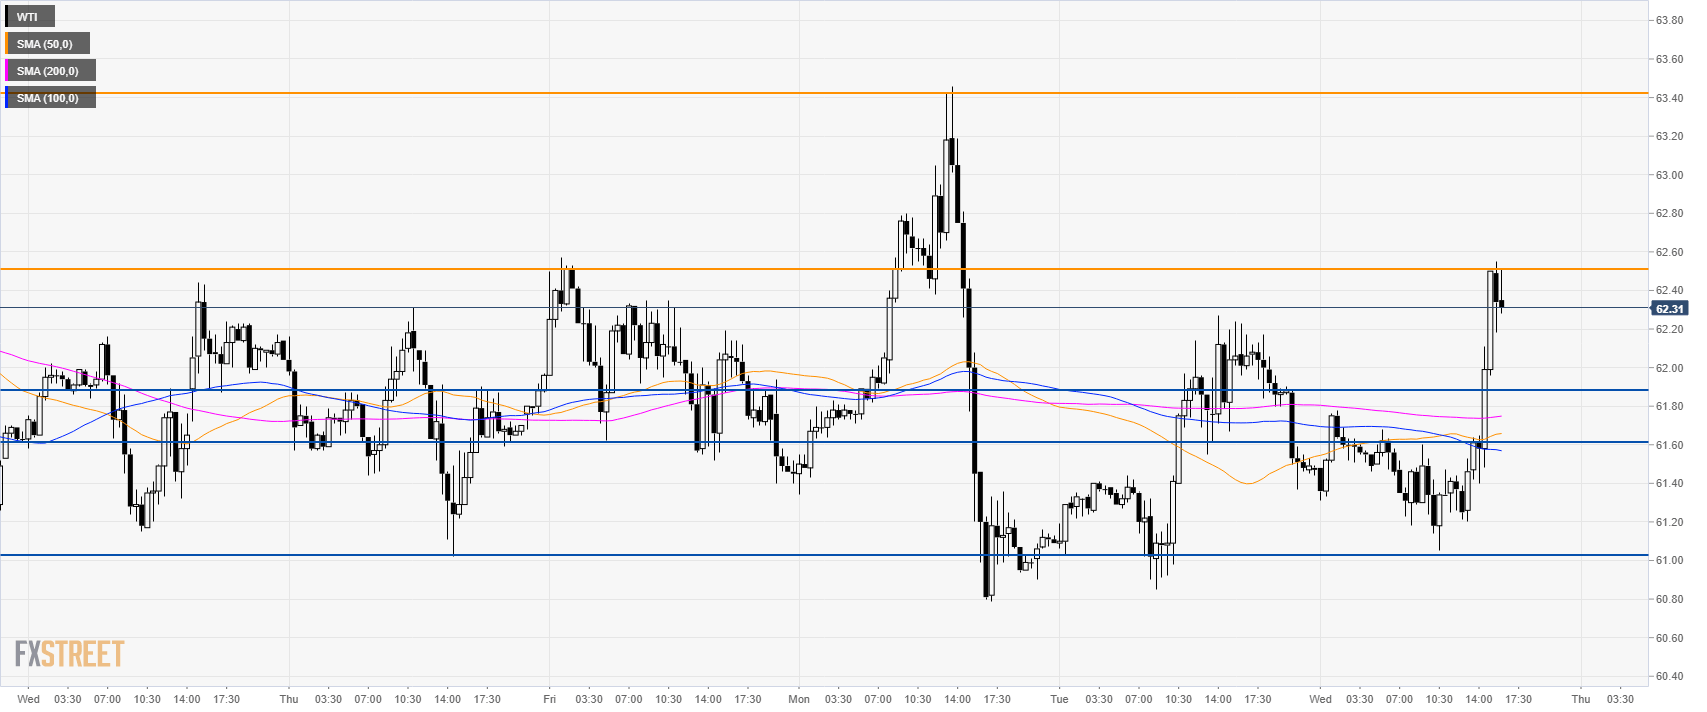
- Earlier on Wednesday, the EIA (Energy Information Administration. ) Crude Oil Stock Change (May 10) came in at 5.431 vs. -0.800M which was essentially a bearish number for crude, however the market jumped.
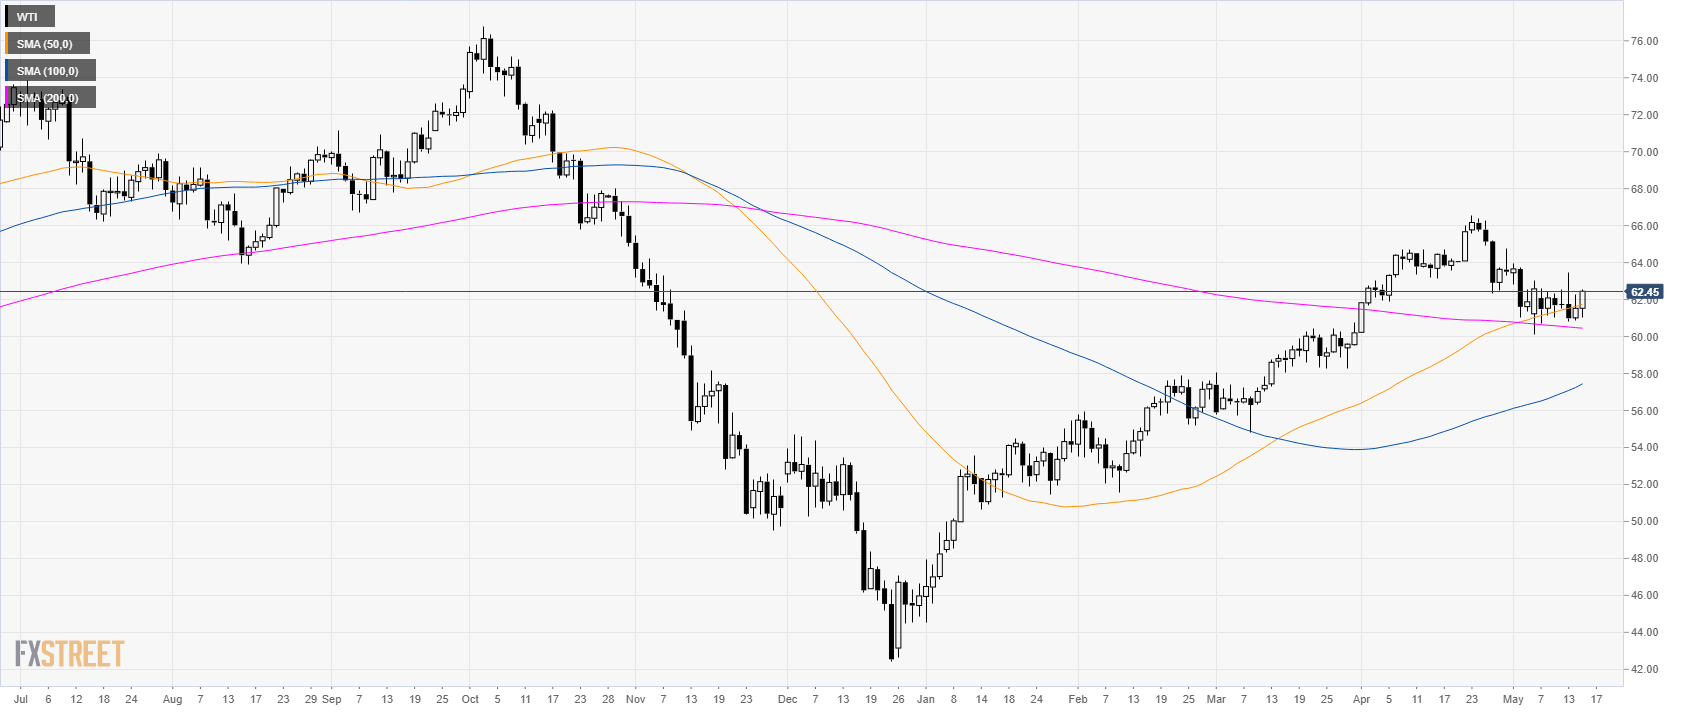
- The market remains stuck in a tight range after WTI peaked near 66.00 a barrel in April.
Oil daily chart
WTI (West Texas Intermediate) is in consolidation mode above its main simple moving averages (SMAs) near $62.00 a barrel.
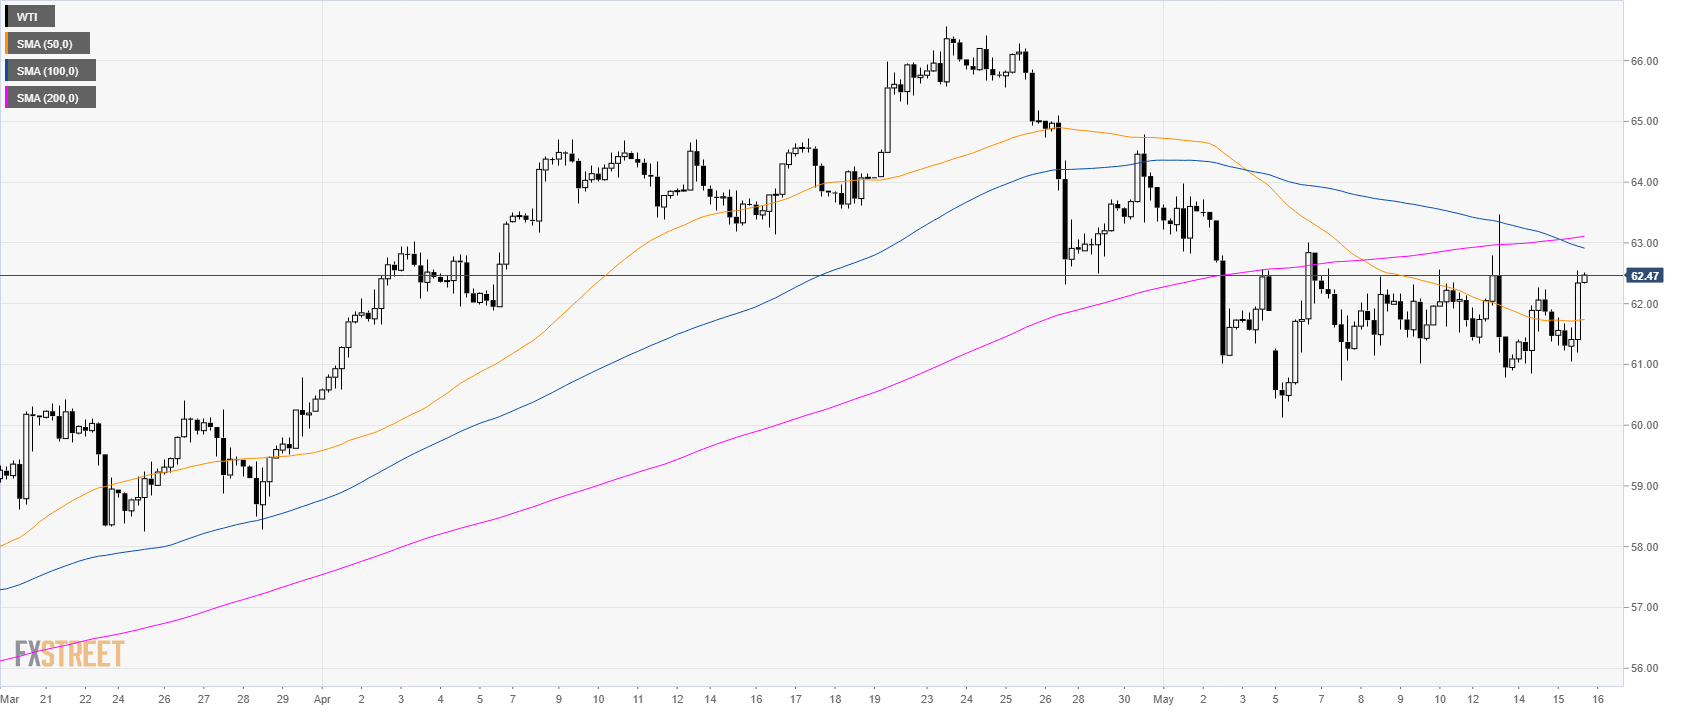
Oil 4-hour chart
On the 4-hour chart, WTI is ranging below its main SMAs suggesting a potential sideways momentum in the medium term.
Oil 30-minute chart
WTI spiked to 62.50 where it has found some resistance. A break above this level can lead to 63.40 swing high. In the near term a consolidation can lead to 61.90/60 to the downside.
Additional key levels
