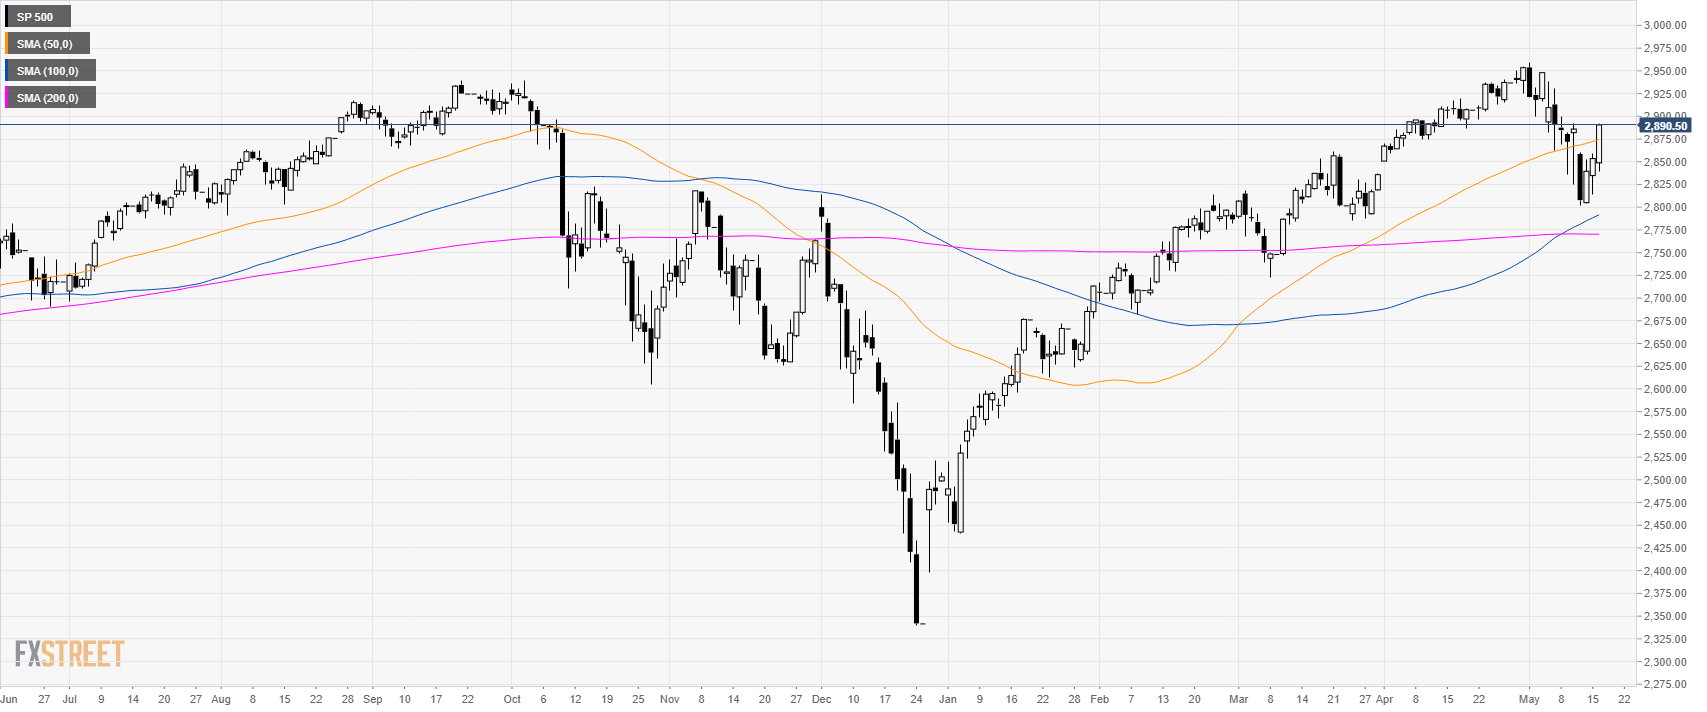
S&P500 daily chart
The S&P500 Index is trading in a bull trend above its 200-period simple moving averages (SMA). The index is up as investors are cheering better-than-anticipated earning figures.
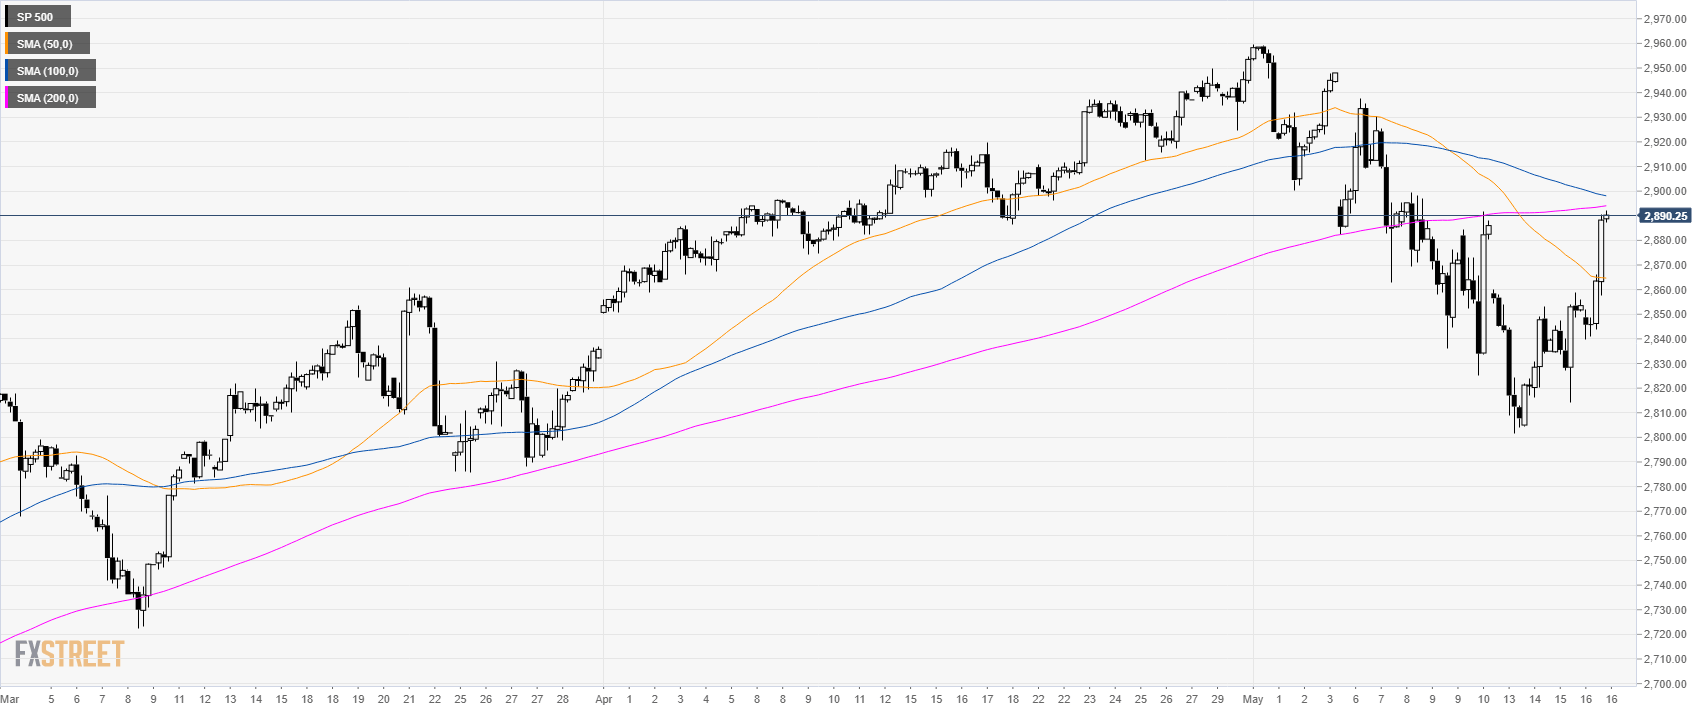
S&P500 4-hour chart
The market is very close to the 2,900.00 figure along with the 100 and 200 SMAs.
As discussed previously, the market hit 2,890.00 this Thursday.
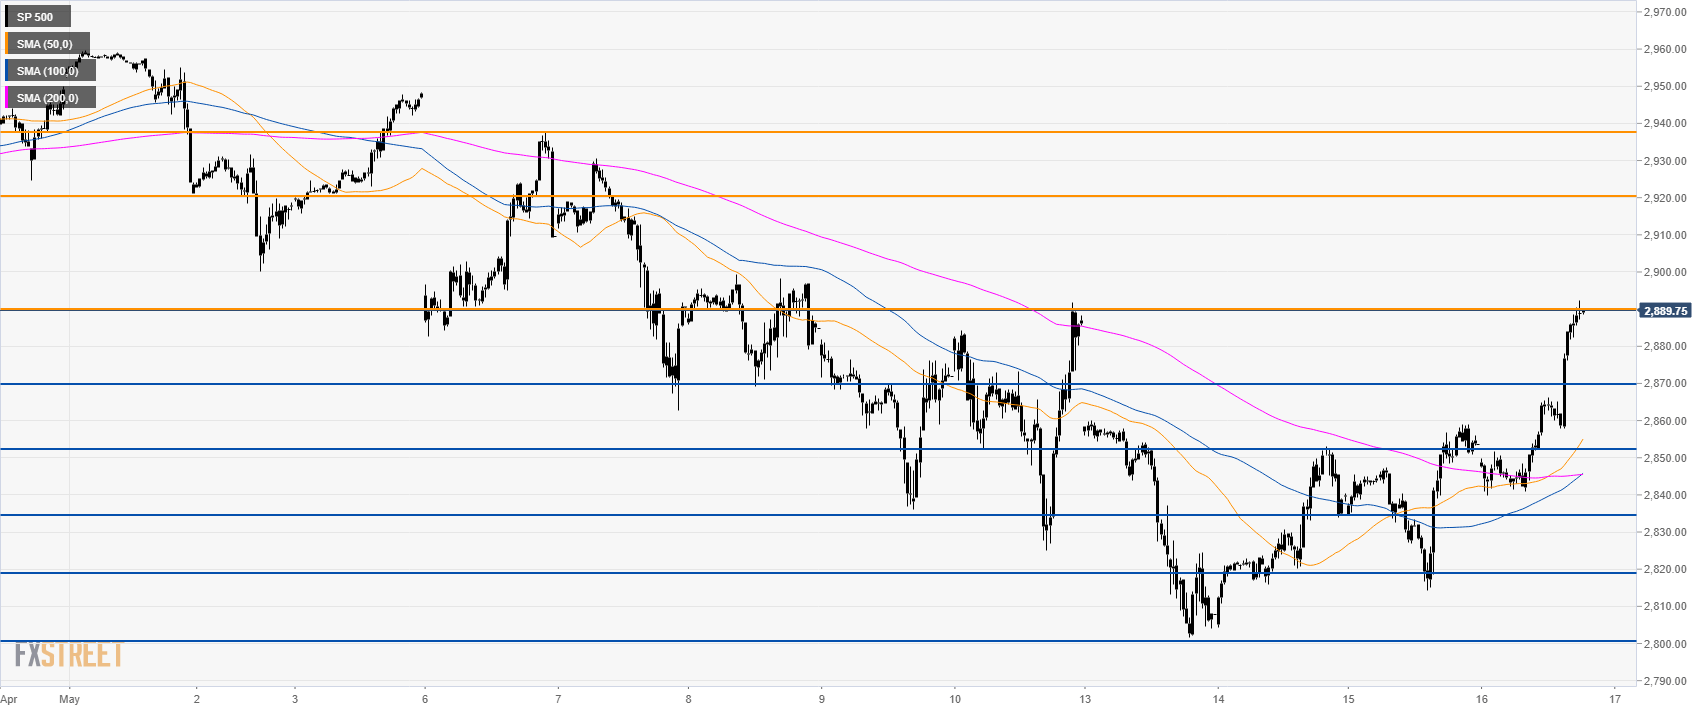
S&P500 30-minute chart
Bulls are back in charge. The next main target is seen at 2,937.00. Before that bulls need to break above 2,890.00 resistance and the 2,920.00 price level.
Support is seen at 2,870.00 and 2,852.00 level.
Additional key levels
