- Three-month-old descending trend-line continue limiting the upside.
- The oversold conditions of 14-day relative strength index (RSI) and 0.6500 mark trouble sellers.
Even if two-month-old descending trend-line restricts NZD/USD upside, oversold RSI conditions limit further downside around 0.6500 ahead of the European open on Wednesday.
As a result, the Kiwi pair might bounce back to confront the aforementioned resistance-line near 0.6540/45, a break of which could escalate the quote’s recovery towards 0.6570 and 21-day simple moving average (SMA) level of 0.6590.
In a case where prices keep rising past-0.6590, 61.8% Fibonacci retracement of its October to December 2018 upside at 0.6635, followed by 50% Fibonacci retracement and 50-day SMA around 0.6700/05, could entertain buyers.
Given the bear’s dominance over sentiment remains intact, a downward sloping trend-line connecting March and April months lows near 0.6485 and October 26 low adjacent to 0.6465 could become their next targets ahead of watching over October 2018 bottom at 0.6425.
NZD/USD daily chart
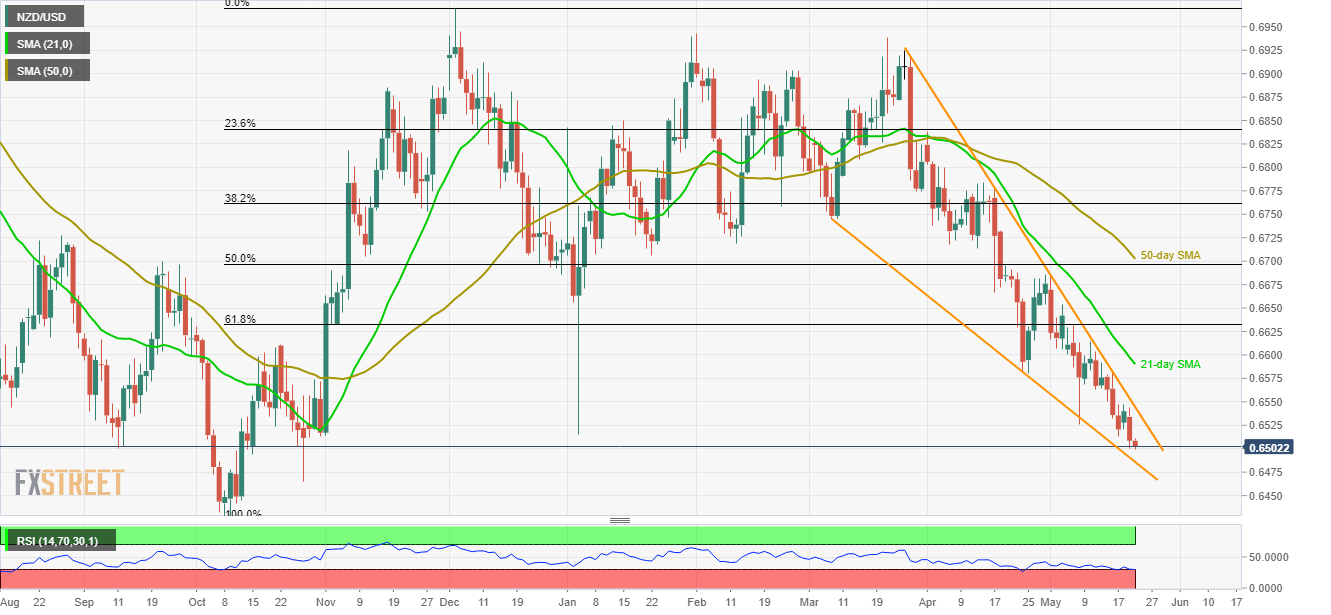
Trend: Pullback expected
