- Failure to surpass 200-day SMA portrays pair’s weakness.
- 21-day SMA offers immediate support.
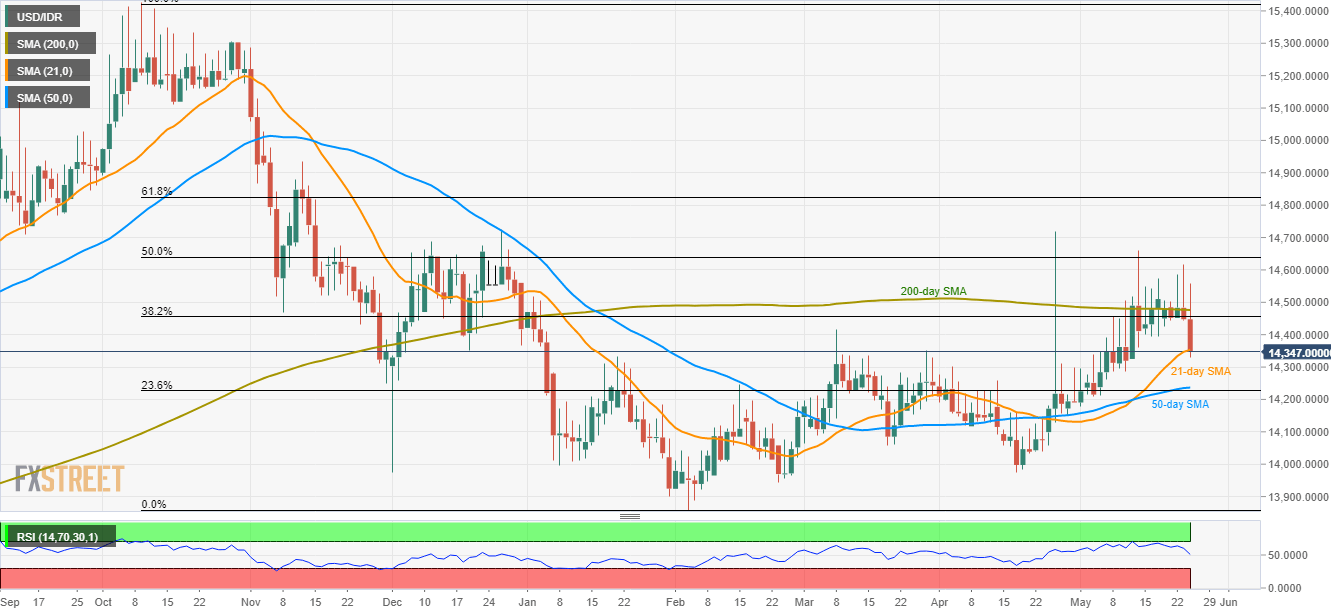
Having failed to successfully cross 200-day SMA, the USD/IDR pair presently tests 21-day SMA as it declines to 14,347 during early Monday.
Should prices slip beneath 21-day simple moving average (SMA) level of 14,350 on a daily closing basis, 14,236/27 area comprising 23.6% Fibonacci retracement of October – February downturn and 50-day SMA can gain sellers’ attention.
If at all there prevails extended downturn past-14,227, 14,100 and 14,000 can offer intermediate halts to the pair’s southward trajectory towards April lows near 13,970.
On the contrary, 38.2% Fibonacci retracement can offer immediate resistance at 14,455, a break of which can escalate the pair’s recovery to 200-day SMA level of 14,480.
In order to justify additional strength to target 14,720/25 resistance-region, the pair needs to clear 50% Fibonacci retracement level around 14,650 on the top of 200-day SMA.
USD/IDR daily chart
Trend: Pullback expected
