- A new wave of fear fueled by the Sino-American trade conflict sends US stocks down.
- The S&P500 broke below 2,800.00 important support.
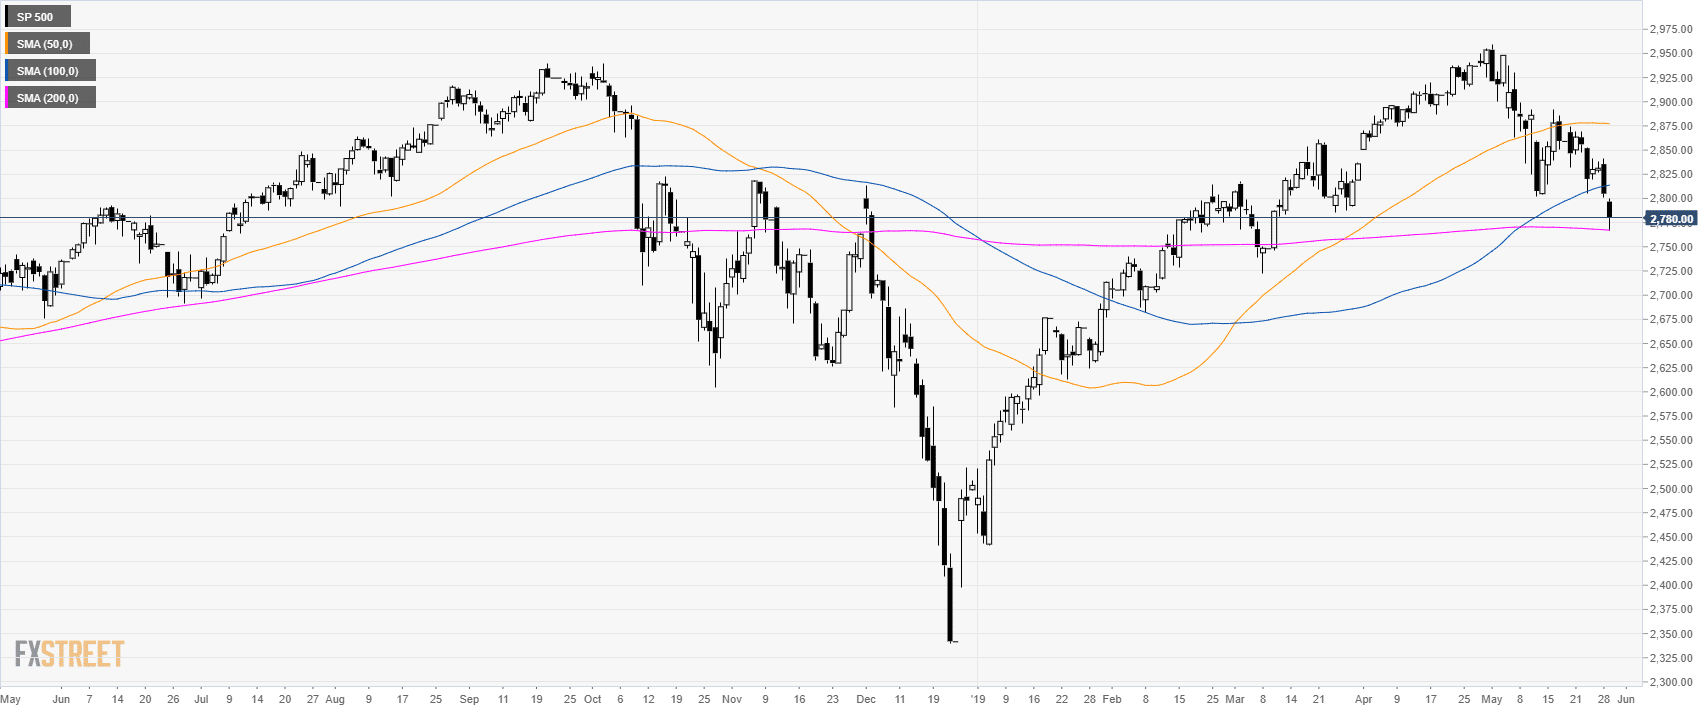
S&P500 daily chart
The S&P500 Index is having a correction down to the 200-period simple moving average (SMA). The bears finally broke below the 2,800.00 support.
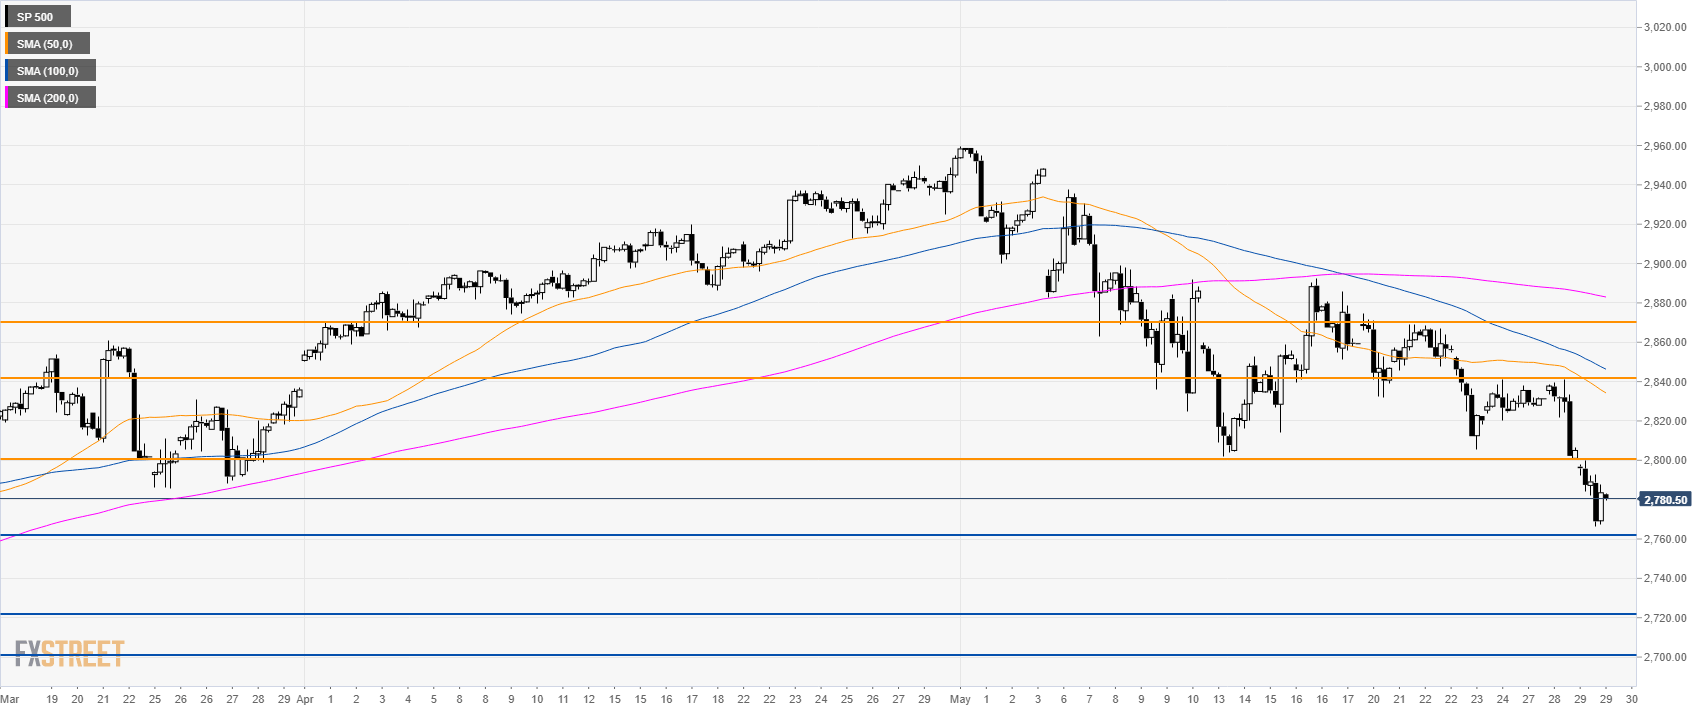
S&P500 4-hour chart
The market is trading below its main SMAs suggesting a bearish bias. The S&P500 found some support just above the 2,760.00 level. If the risk-off mood persists bears could reach the 2,720.00 and 2,700.00 handle. Resistances are seen at 2,800.00 and 2,840.00 levels.
Additional key levels
