- New Zealand building permits lagged behind market consensus and dropped to the lowest since July 2018.
- 23.6% Fibonacci retracement of mid-month decline limits immediate downside.
Despite witnessing 9-month low building permits from New Zealand, the NZD/USD pair still holds above 23.6% Fibonacci retracement of its immediate declines as it seesaws near 0.6515 during early Thursday.
New Zealand’s April month seasonally adjusted building permits slipped to the lowest since July to -7.9% versus a forecast of +1.3% gain and downwardly revised -7.4% prior.
With the sustained trading beyond immediate support, prices may now confront 21-bar simple moving average (SMA) near 0.6520 ahead of rising towards 0.6540 and 61.8% Fibonacci retracement near 0.6550.
Additionally, pair’s advances after 0.6550 can have 0.6560, 0.6585 and 0.6600 as follow-on upside targets.
On the downside, a clear break beneath 23.6% Fibonacci retracement level of 0.6505 can open fresh leg of declines toward the latest low near 0.6480.
Though, extended south-run under 0.6480 might not refrain from meeting October 2018 low around 0.6425.
NZD/USD hourly chart
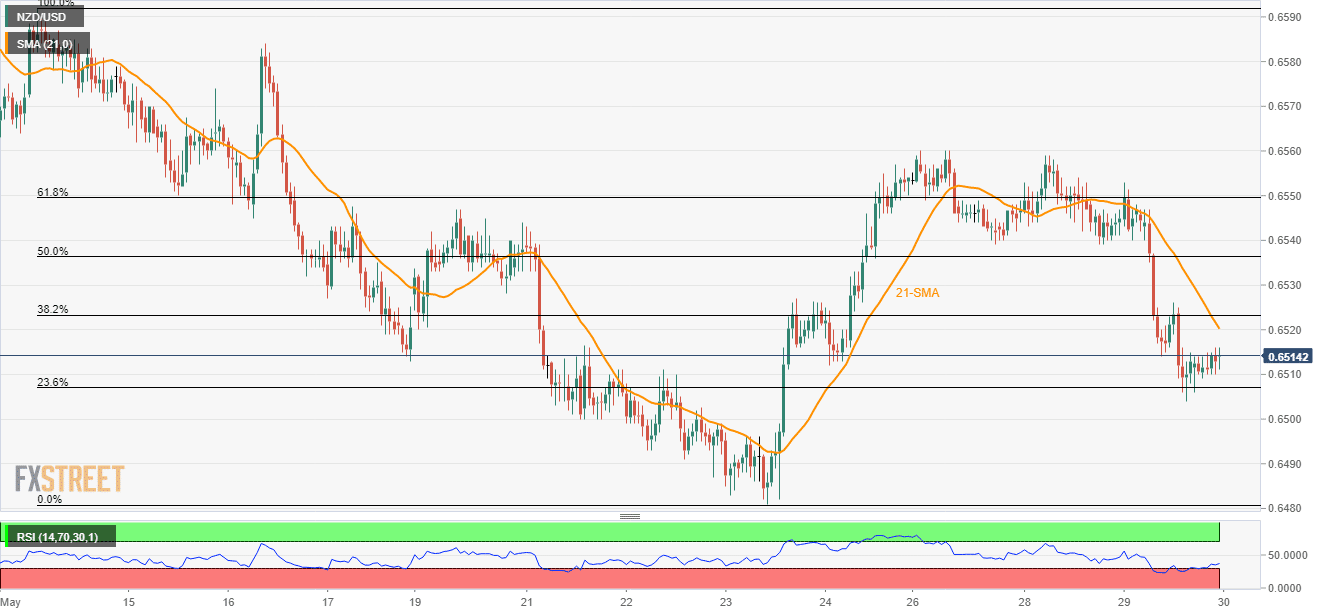
Trend: Pullback expected
