- AUD/USD has been trading in a 30-pip range the all week.
- The market can essentially break in either direction of the range.
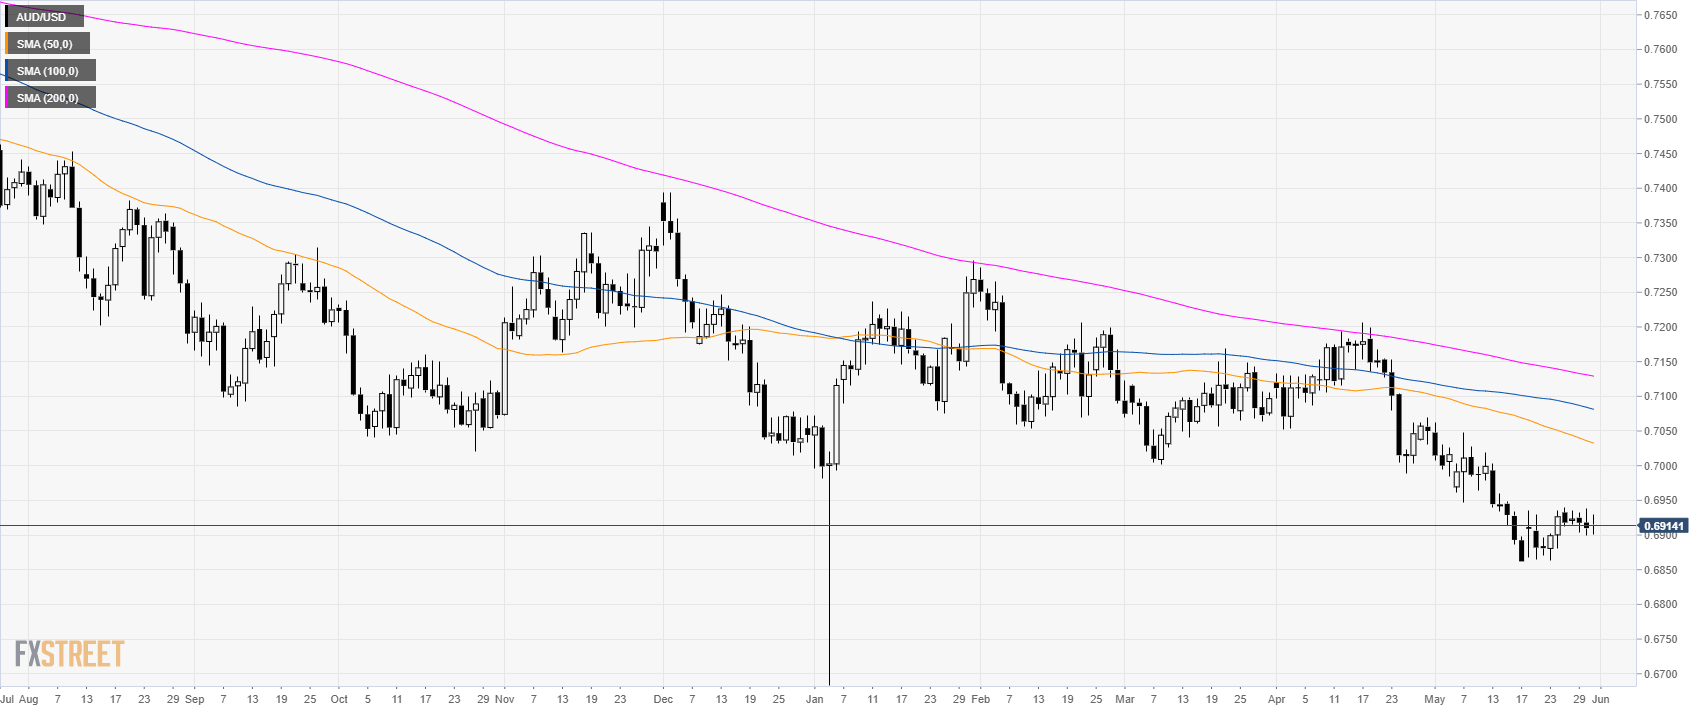
AUD/USD daily chart
AUD/USD is in a bear trend below its main simple moving averages (SMAs).
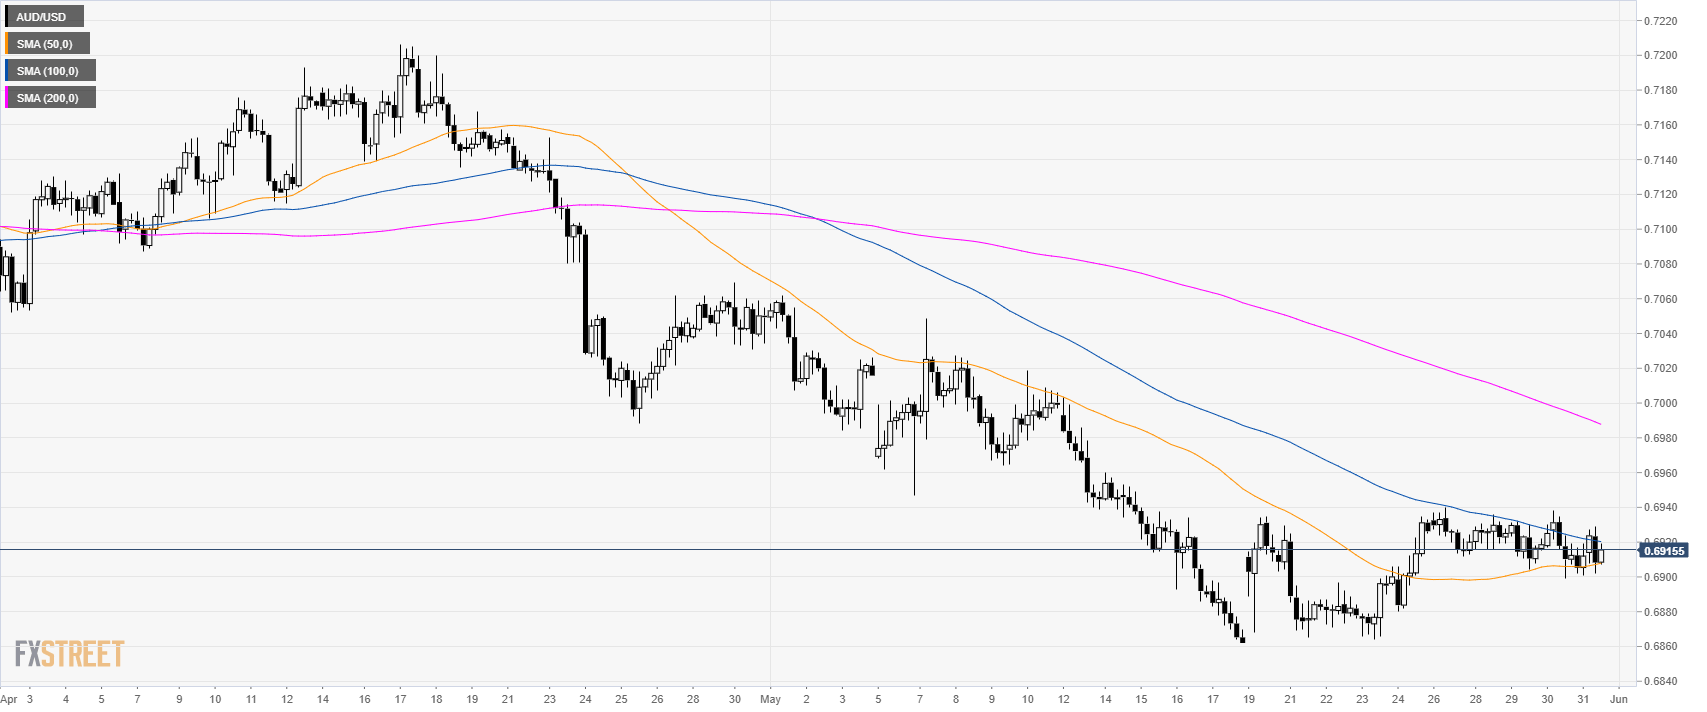
AUD/USD 4-hour chart
AUD/USD is pinched between the 100 and 200 SMAs above the 0.6900 handle.
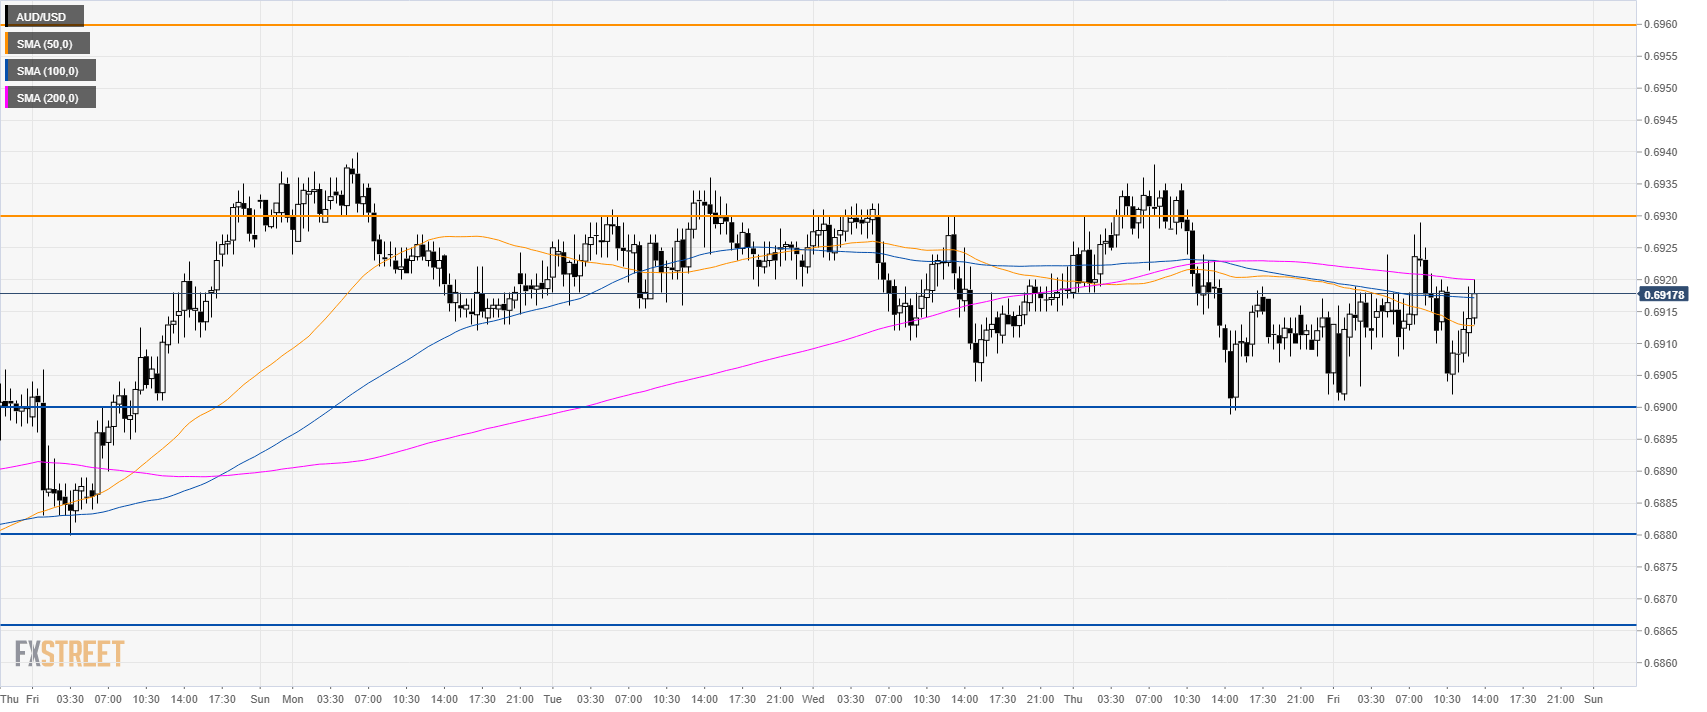
AUD/USD 30-minute chart
The Aussie is trading above 0.6900 support. Buyers need a break above 0.6930 to reach 0.6960 while sellers need a break below 0.6900 to reach 0.6880.
Additional key levels
