- Failure to cross nearby resistance zone portrays pair’s weakness.
- Oversold RSI conditions question bears.
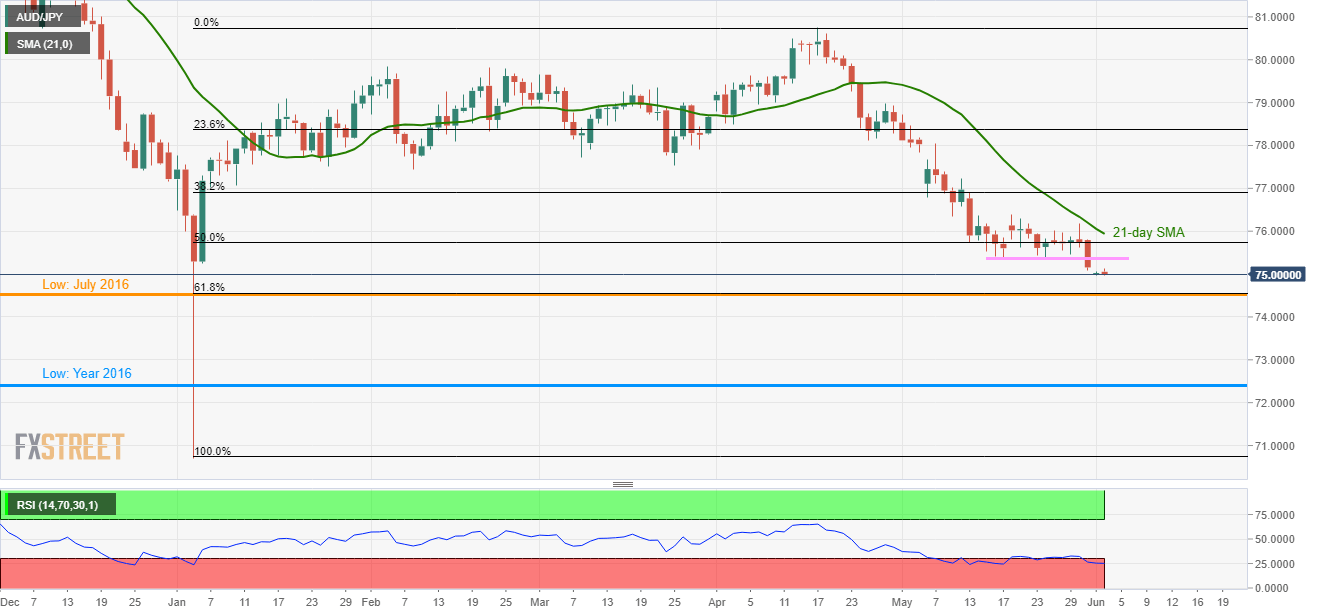
Although AUD/JPY clings to 75.00 amid oversold levels of 14-day relative strength index (RSI) on early Monday, sustained trading beneath immediate important resistances indicates the quote’s weakness.
Among the resistances, 75.30/40 region comprising lows marked during the current month before Friday seems of higher importance as a break of which can trigger the pair’s recovery towards 21-day simple moving average (SMA) near 76.00.
Should there be additional upside past 76.00, 76.40 and 77.00 might flash on buyers’ radar to target.
In a case where the sellers refrain from respecting oversold RSI conditions, 74.55/50 area seems crucial to watch as it encompasses lows marked during July 2016 and 61.8% Fibonacci retracement level of January to April 2019 upside.
If at all bears keep dominating past-74.50, the year 2016 bottom around 72.40 can offer an intermediate halt to likely price plunge towards January month low near 70.70.
AUD/JPY daily chart
Trend: Bearish
