- WTI is consolidating the losses seen in the last weeks of trading.
- The level to beat for bears is 53.00 while the market is currently capped by 55.00 resistance.
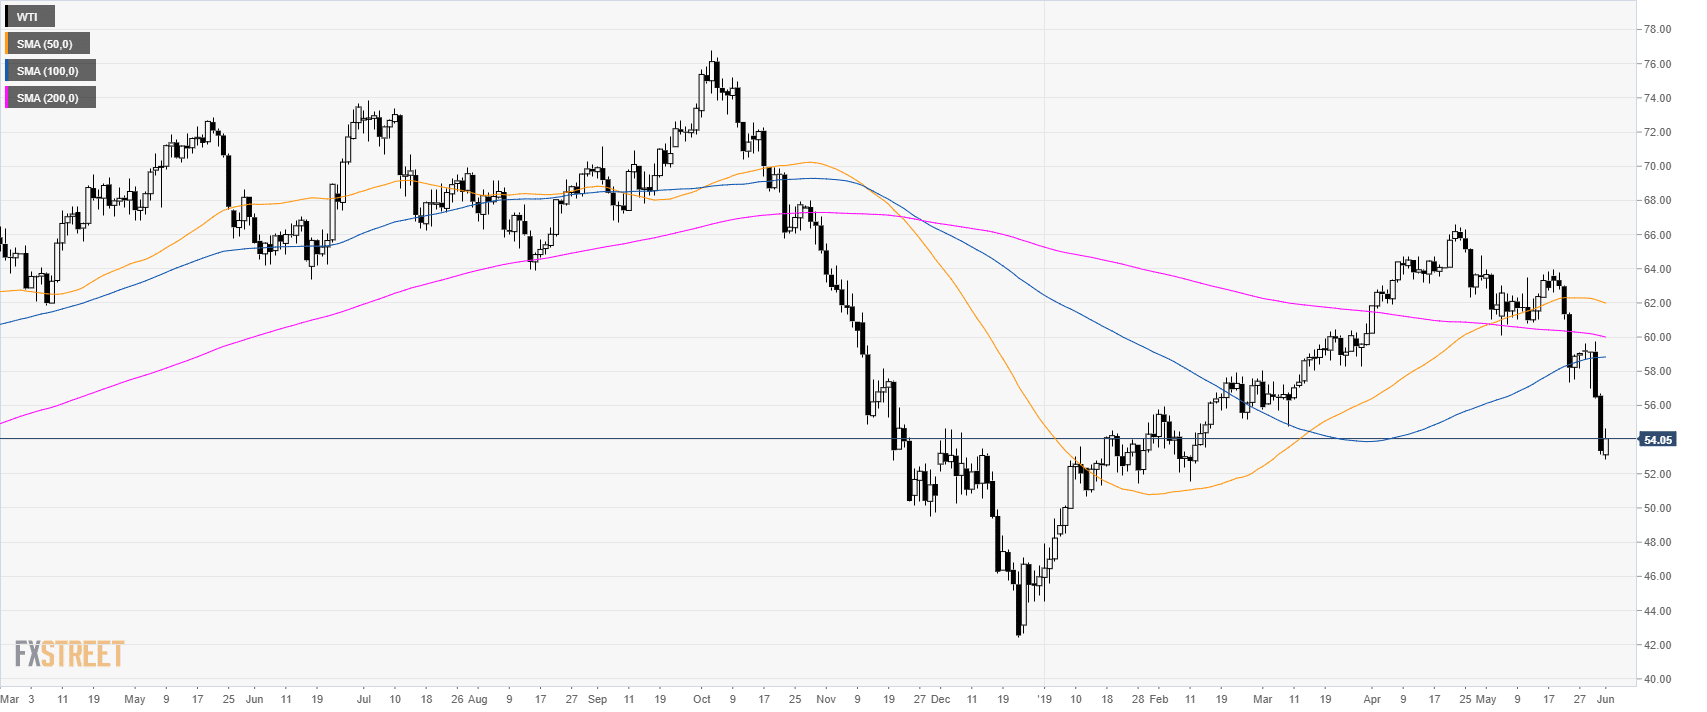
Oil daily chart
On the daily time frame, WTI oil (West Texas Intermediate) is having a deep correction down as the market is trading below the main simple moving averages (SMAs).
Oil 4-hour chart
WTI is under selling pressure below its main SMAs. A beak below 53.00 can open the doors to 51.00 a barrel to the downside. Resistance is seen at 55.00, 57.00 and 59.80.
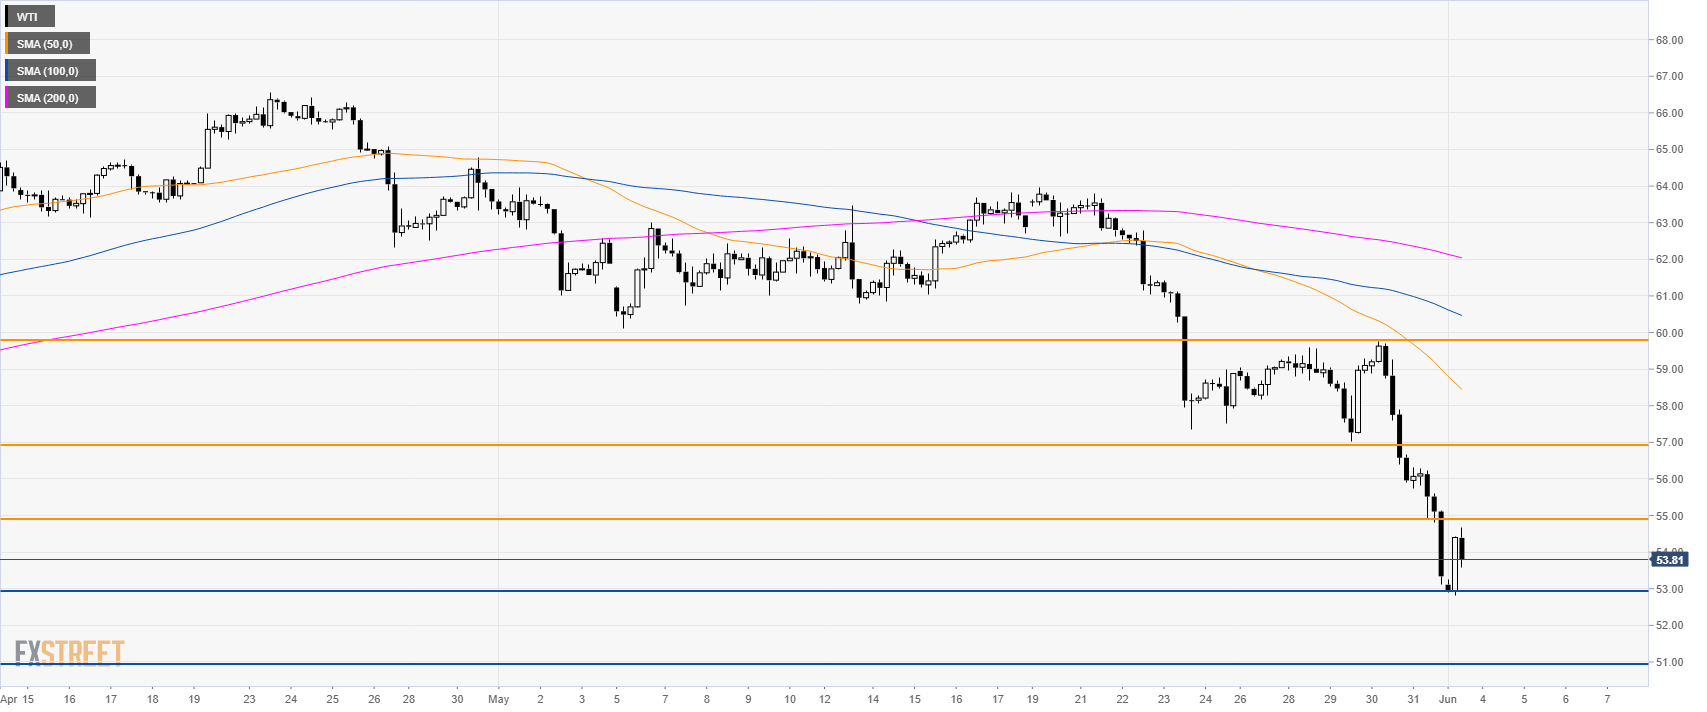
Additional key levels
