- New Zealand’s terms of trade index grew to the highest in over a year.
- Overbought RSI conditions and 61.8% Fibonacci retracement questions buyers despite the quote’s sustained trading beyond 4H 200MA.
Despite New Zealand’s upbeat quarterly trade data, the NZD/USD pair couldn’t extend its latest advances as it traders near 0.6600 during early Tuesday.
Overbought levels of 14-bar relative strength index (RSI) and 61.8% Fibonacci retracement of April-end to May month declines limit the pair’s immediate upside even if Q1 2019 figures of New Zealand terms of trade index surged to highest in a year by matching 1.0% forecast versus -3.0% prior.
As a result, 200-bar moving average on the 4-hour chart (4H 200MA) at 0.6585 gains sellers’ attention, a break of which can fetch the quote to 38.2% Fibonacci retracement level near 0.6560 and then to 0.6530 comprising 23.6% Fibonacci retracement.
In a case where prices keep trading southwards past-0.6530, 0.6480 and October 2018 low surrounding 0.6425 may flash on bears’ radar.
On the upside, 61.8% Fibonacci retracement level near 0.6610 acts as nearby resistance for the pair to break in order to extend its latest upward trajectory towards 0.6615.
If bulls continue dominating trade sentiment after 0.6615, 0.6645/55 and 0.6690 can become their favorites.
NZD/USD 4-Hour chart
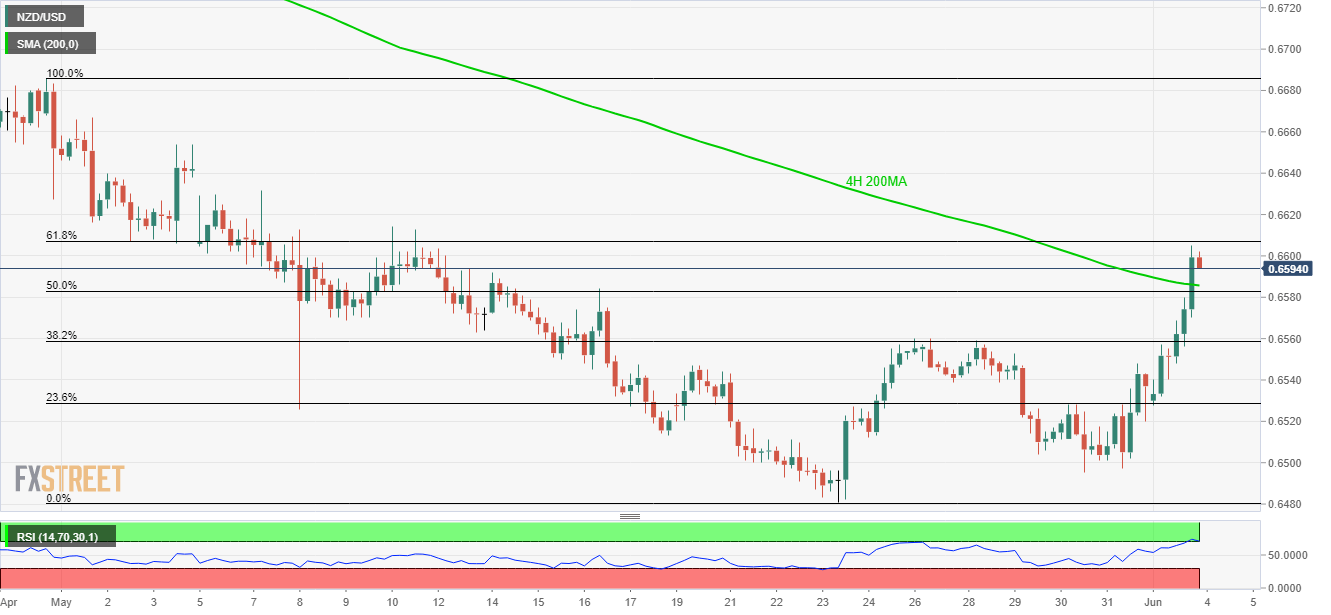
Trend: Pullback expected
