- Short-term resistance-line, 200-HMA acts as important upside barriers.
- Overbought RSI levels can support counter-trend traders.
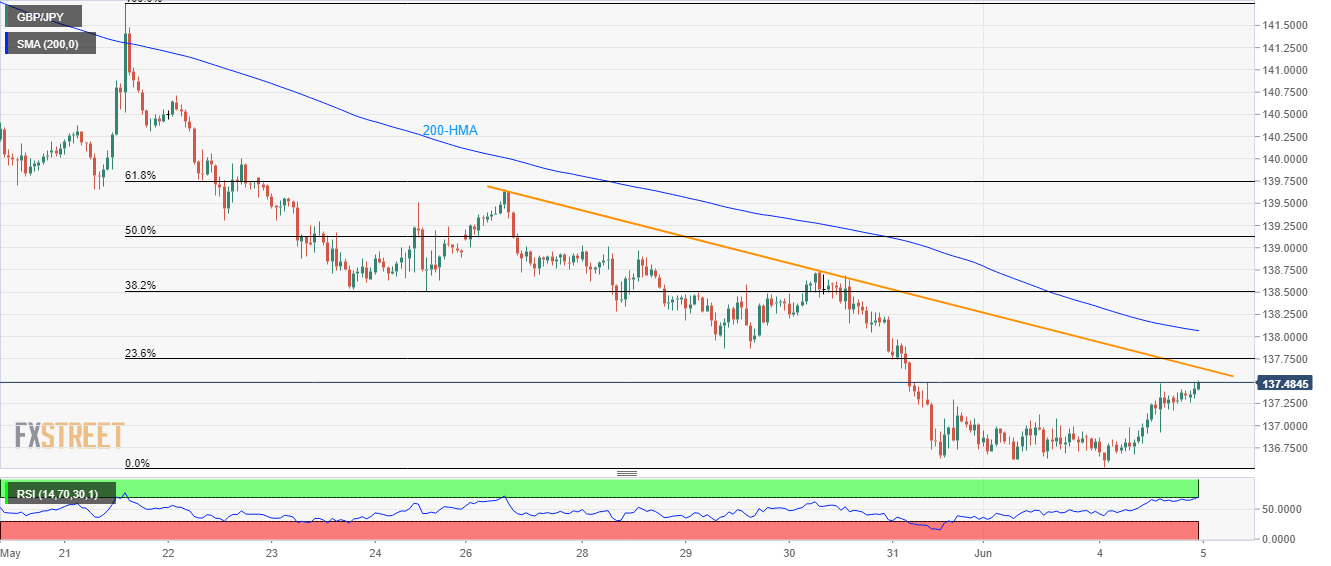
Despite its gradual upward trajectory since yesterday, the GBP/JPY pair still lags behind a week-long resistance-line as is takes the rounds near 137.45 amid initial Asian session on Wednesday.
Not only a downward sloping trend-line since May 27 at 137.65 but 200-hour moving average (HMA) level of 138.07 could also question buyers.
If at all prices manage to cross 138.07, 38.2% Fibonacci retracements of the pair’s fortnightly downturn at 138.55 and 139.00 could grab the spotlight.
However, overbought levels of 14-bar relative strength index (RSI) signal brighter chances of the quote’s pullback to 137.15 and then to a recent low near 136.50.
Further, pair’s extended downpour under 136.50 highlights January 04 low around 135.80 for the bears.
GBP/JPY hourly chart
Trend: Pullback expected
