- 50-day and 200-day SMA limits immediate moves.
- Aussie GDP in the spotlight.
AUD/NZD slips beneath 50-day SMA to 1.0575 ahead of Australia’s GDP release on early Wednesday.
Australia’s first quarter (Q1) 2019 gross domestic product (GDP) is expected to rise to 0.5% from 0.2% on QoQ but might weaken to 1.8% from 2.3% on a yearly basis.
The pair can avail 1.0550 and 1.0520 as immediate support before testing 50% Fibonacci retracement of March to April upside at 1.05000 mark.
During the pair’s declines beneath 1.0500, 61.8% Fibonacci retracement at 1.0450, followed by 1.0400, may grab market attention.
Alternatively, sustained break of 50-day simple moving average (SMA) level of 1.0580 can propel prices to confront the 200-day SMA level of 1.0620.
Given the quote’s extended rise above 1.0620, 1.0635, 1.06752 and April month top near 1.0735 can be targeted in the case holding the long positions.
AUD/NZD daily chart
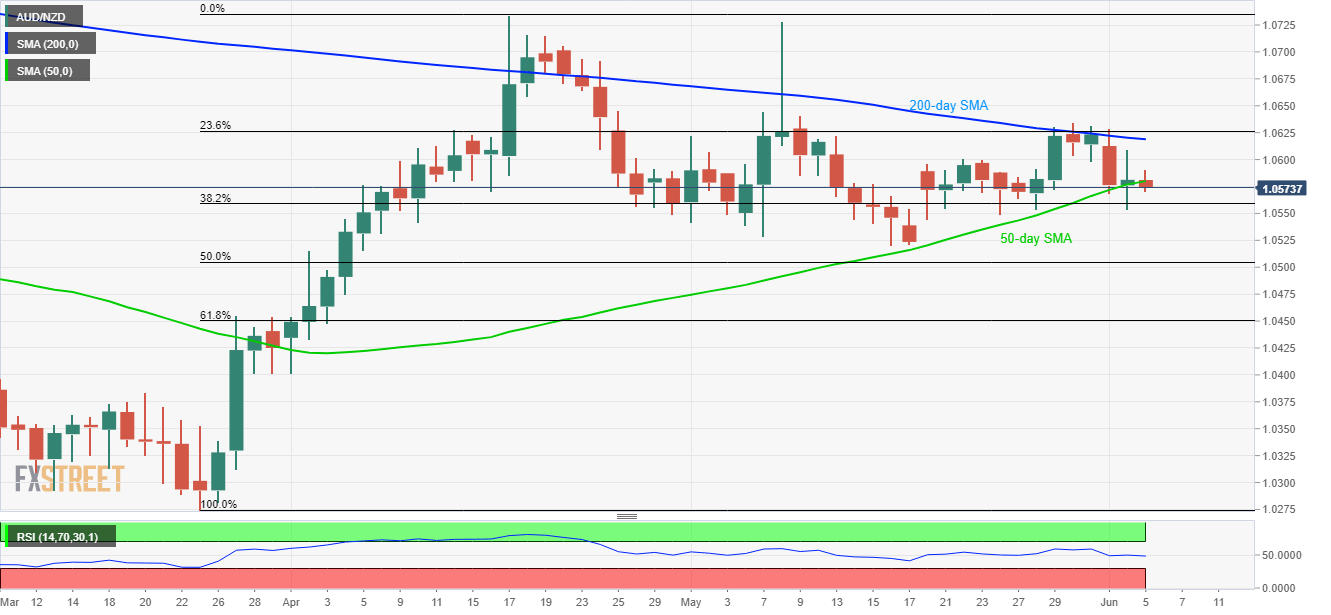
Trend: Bearish
