- Prices remain strong to confront 61.8% Fibonacci retracement and 50-day SMA.
- The further rise can be capped by 0.6670.
In spite of its pullback around late-Wednesday, NZD/USD again aims to cross 50-day SMA as it confronts 61.8% Fibonacci retracement level of 0.6631 during early Thursday.
While 50-day simple moving average (SMA) level of 0.6640 acts as immediate resistance for the pair, 0.6670 number including the latest high and low of April 17 could question buyers afterward.
If prices manage to cross 0.6670 mark, 50% Fibonacci retracement level of October – December 2018 upside at 0.6700 and 0.6710 level encompassing 200-day SMA could grab market attention.
Alternatively, 0.6600 round-figure and late-April lows near 0.6580 can entertain sellers during the quote’s pullback whereas last week’s high at 0.6560 and May month bottom around 0.6460 could flash on their radar in a case of further downside.
NZD/USD daily chart
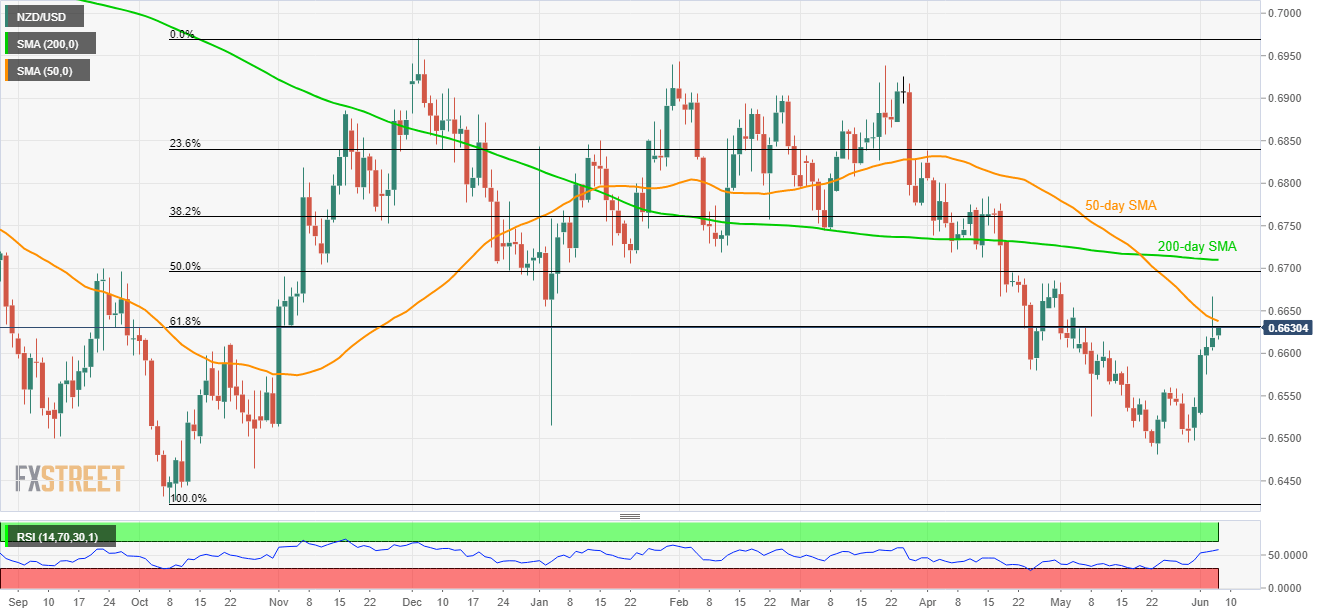
Trend: Bullish
