- Medium-term horizontal-line, overbought RSI question the pair’s upside.
- 200-day SMA offers strong downside support.
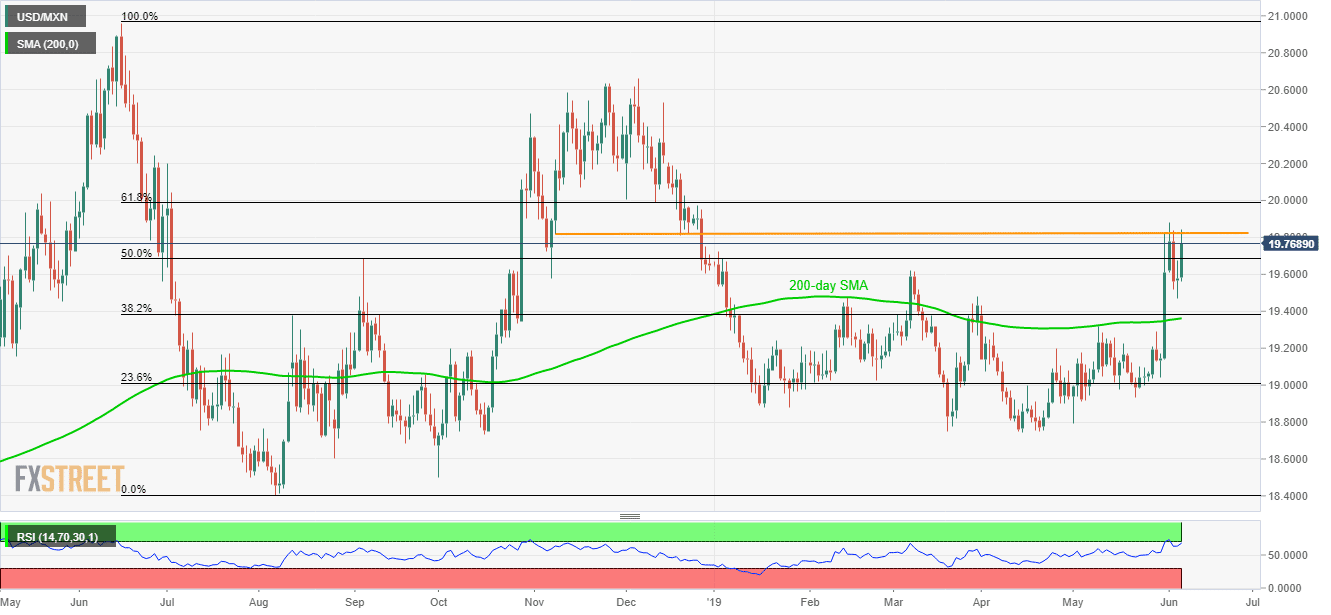
Even after rising on the US-Mexico trade tensions during the early Asian session, the USD/MXN pair couldn’t clear 19.83 resistance as it seesaws near 19.77 ahead of the European opening on Thursday.
The horizontal-line stretched since November 08 continues to offer tough resistance to the quote while 14-day relative strength index (RSI) is also in the overbought area.
Should prices clear 19.83 barriers, 61.8% Fibonacci retracement of June to August 2018 downpour at 20.00, followed by 20.38/40, could challenge bulls.
On the downside, 19.43 can act as immediate support before diverting the moves to 200-day simple moving average (SMA) level of 19.36.
In a case where prices slip under 19.36, 19.2350 and 19.00 might play their role of support.
USD/MXN daily chart
Trend: Pullback expected
