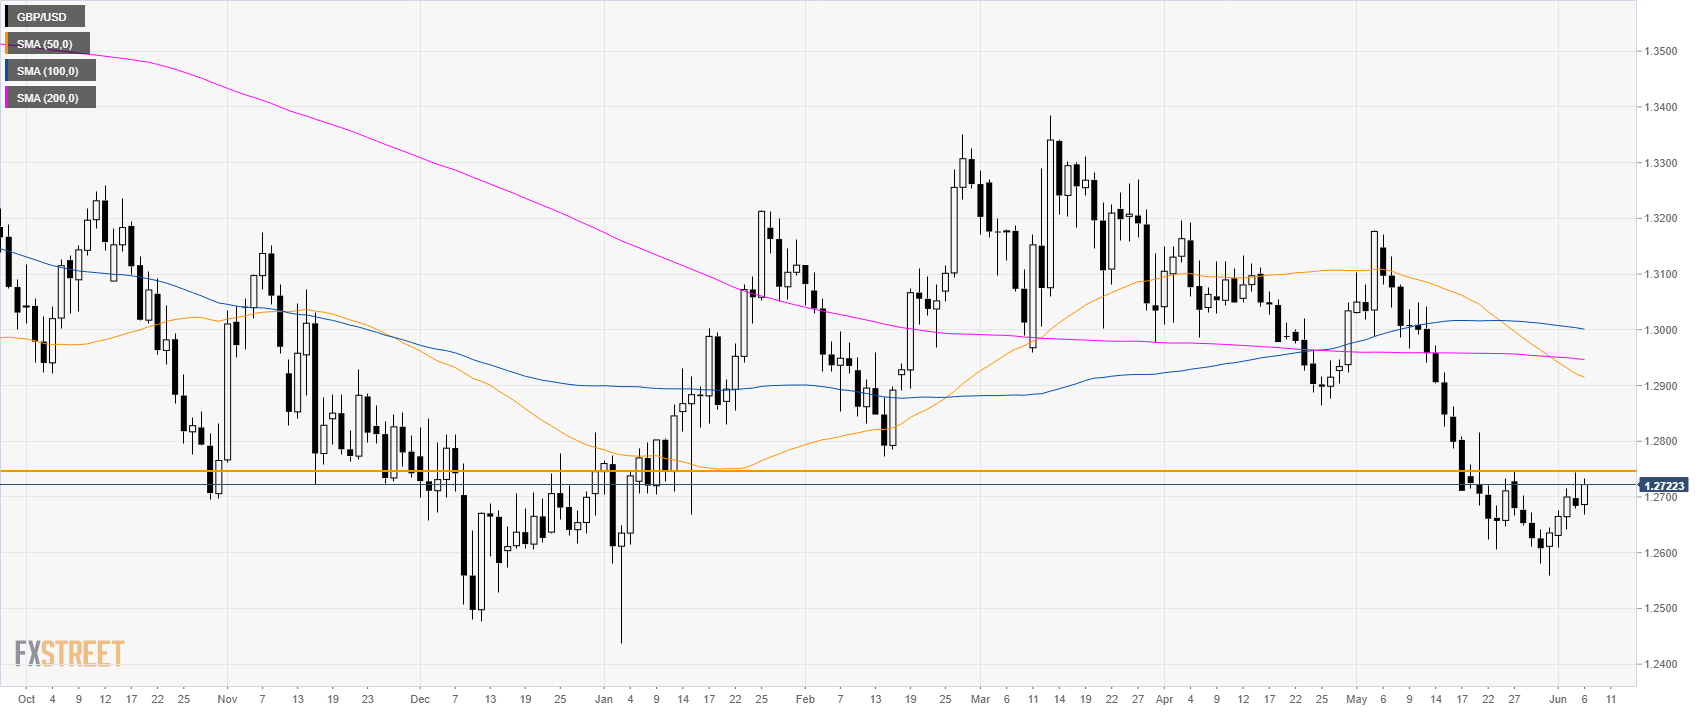
- GBP/USD is consolidating the heavy losses seen in May.
- GBP/USD is trapped in a range near the 1.2700 figure.
GBP/USD daily chart
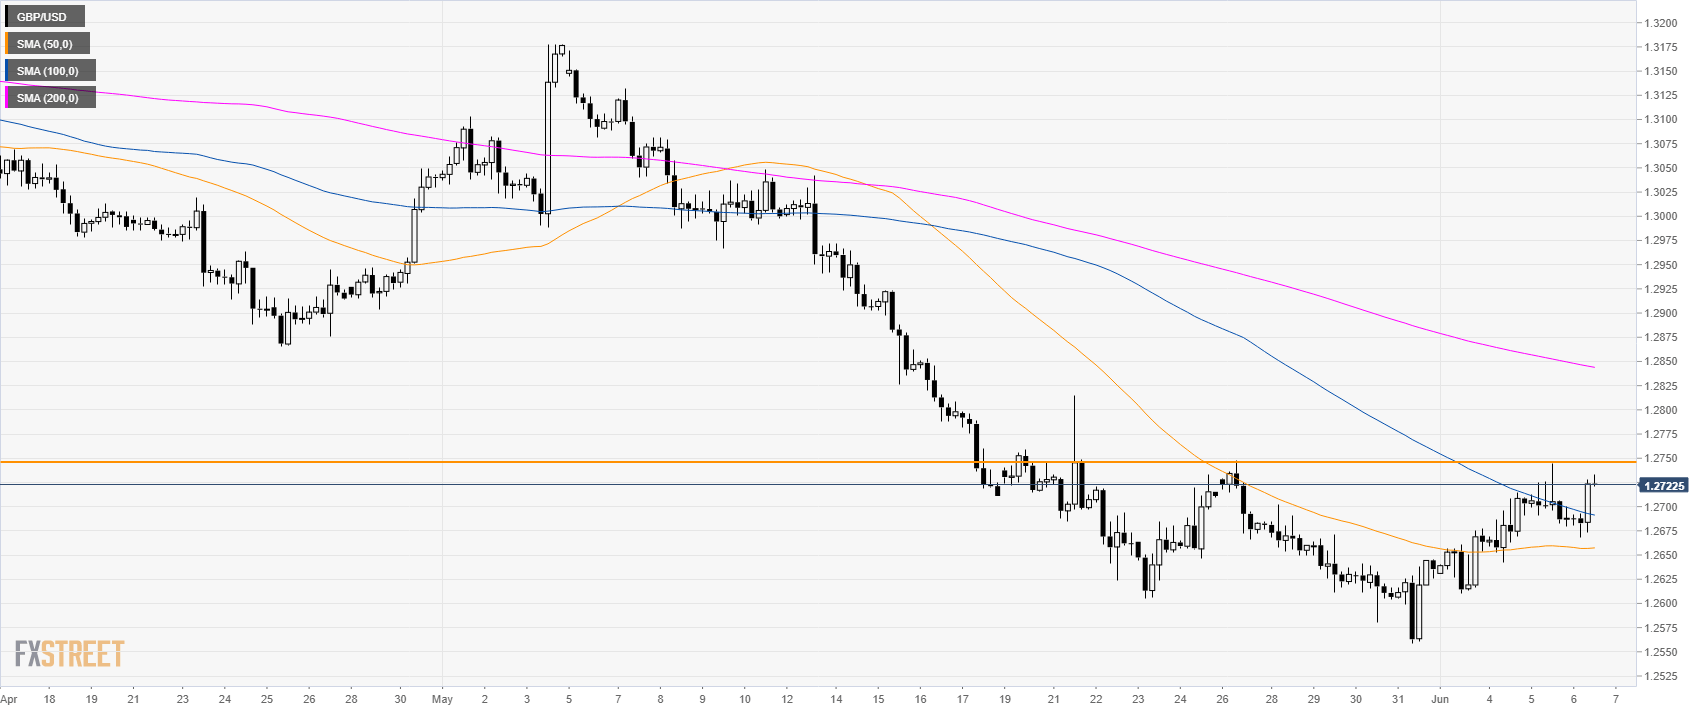
GBP/USD is consolidating the May losses below 1.2750 resistance.
GBP/USD 4-hour chart
Cable is trading above the 50 and 100 SMA suggesting a consolidation phase in the medium term.
GBP/USD 30-minute chart
The market seems to have entered a range between 1.2670 and 1.2750. Bears need a break below 1.2670 to reach 1.2640 and 1.2600 figure while bulls would need a break above 1.2750 to reach 1.2800 figure.
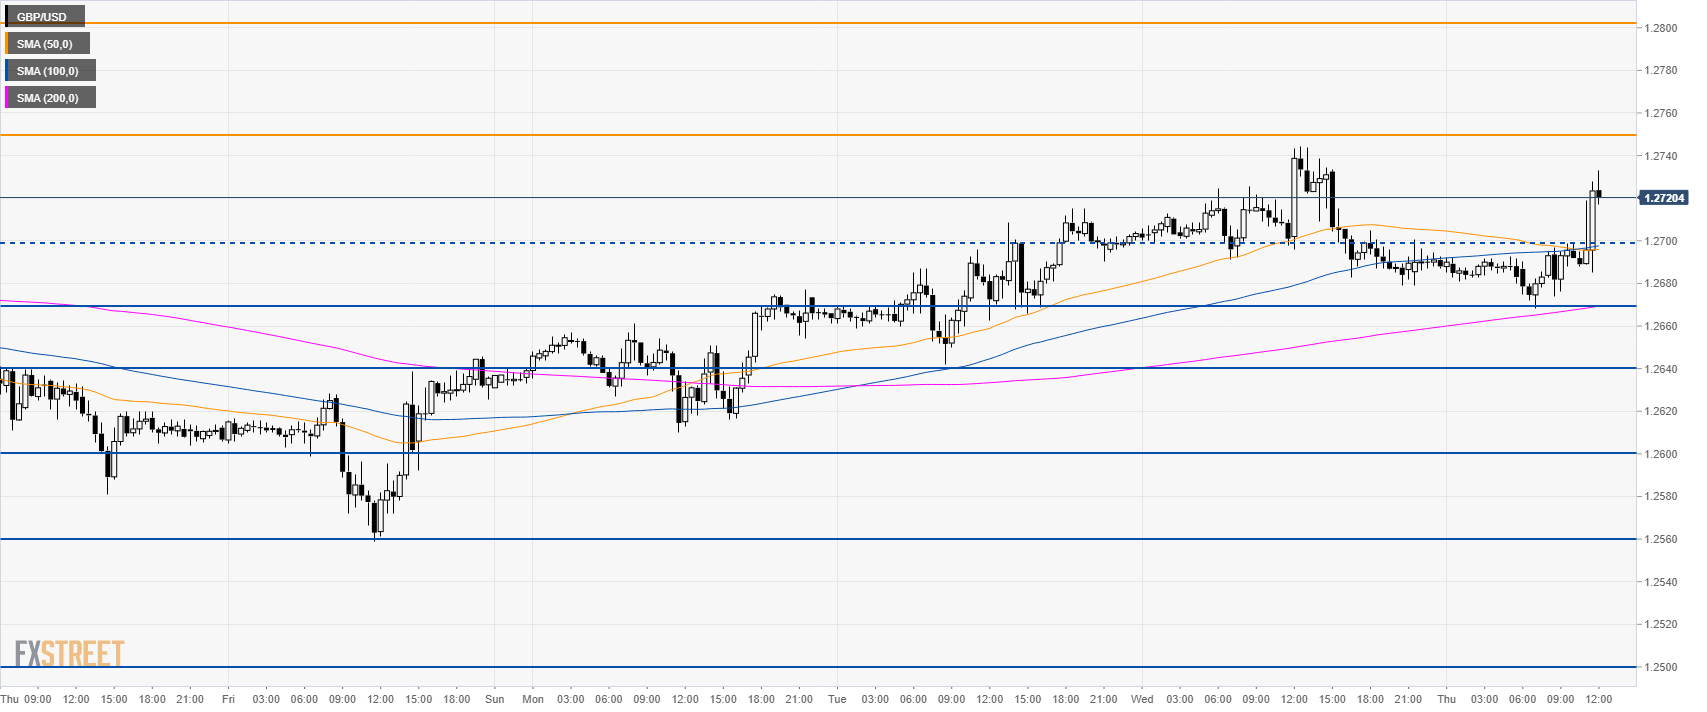
Additional key levels
