- 50 and 200-hour moving averages (HMA) limit immediate downside.
- A weeklong symmetrical triangle is also in play.
Even if symmetrical triangle formation limits the AUD/JPY pair’s moves since May-end, AUD/JPY respects the confluence support of 50 and 200 HMAs as it trades near 75.67 during early Friday.
With this, pair’s recent U-turn can again question the symmetrical triangle resistance at 75.81, a break of which could trigger fresh advances to 75.91 and May 30 high near 76.10.
During the quote’s rise past-76.10, 76.40 and 77.00 could become buyers’ favorites.
On the downside, 75.55/57 confluence limits the declines ahead of dragging the quote to formation support around 75.35.
In a case where prices slip under 75.35, 75.10 and 75.00 might play their role of support.
AUD/JPY hourly chart
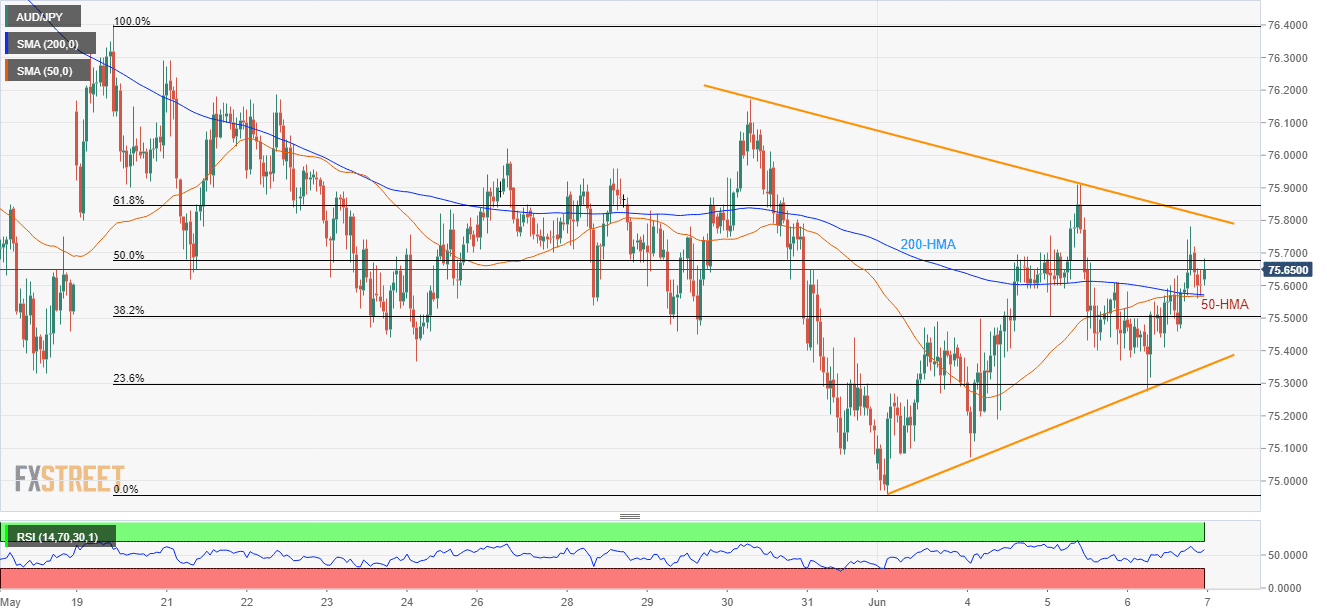
Trend: Bullish
