- USD/CAD hits multi-week lows in Asia, could slide further in the short-term.
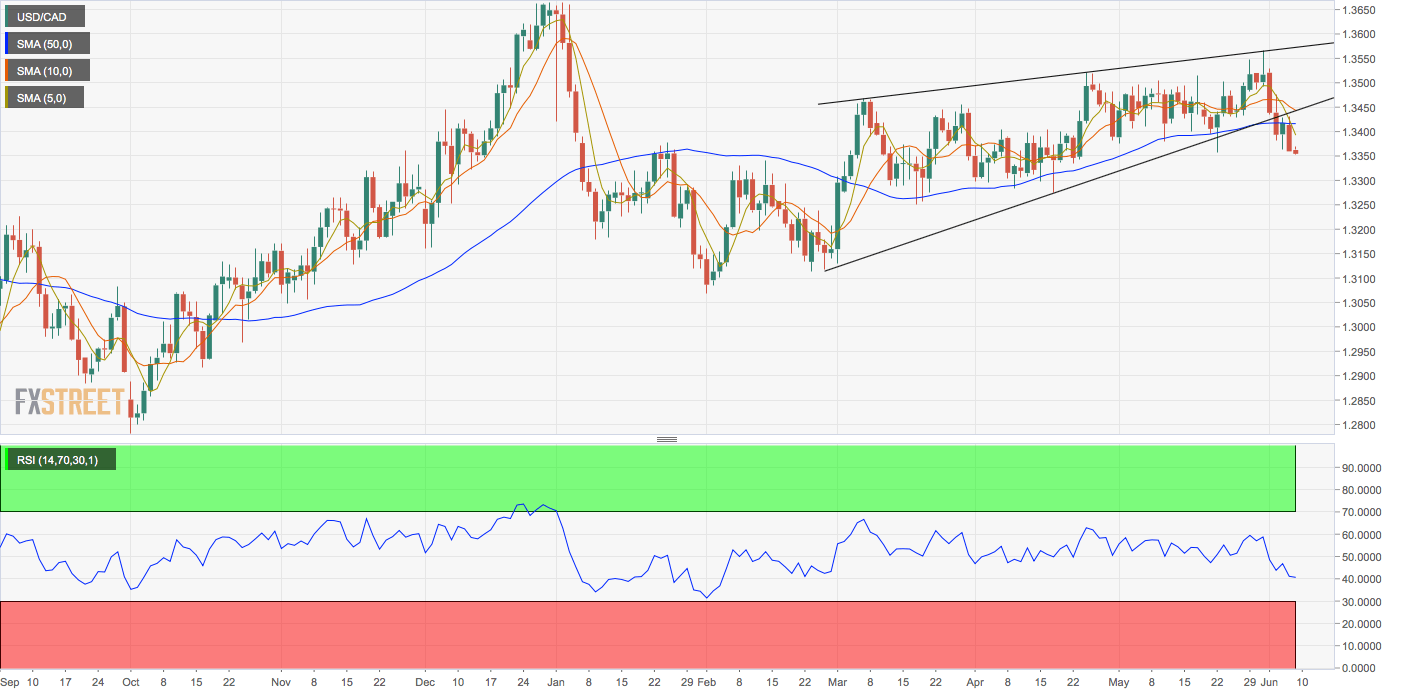
- The daily chart shows a rising wedge breakdown.
- The relative strength index is biased bearish.
USD/CAD is extending overnight losses, now trading at 1.335 – the lowest level since April 23.
The drop to multi week lows is in line with the bearish view put forward by the rising wedge breakdown confirmed on June 4.
The rising wedge breakdown indicates a bullish-to-bearish trend change and is accompanied by below-50 reading on the relative strength index (RSI).
Further the 5- and 10-day moving averages are trending south, indicating a bearish setup and the pair has found acceptance below the 50-day moving average line for the first time March 3.
As a result, the risks are skewed to the downside with a scope for a slide toward the April 17 low of 1.3274.
A close above the 10-day MA, currently at 1.3443 would invalidate the bearish setup, although that looks unlikely in the short-term.
Daily chart
Trend: Bearish
Pivot points
