- The US Dollar Index (DXY) tumbled following the release of the US Nonfarm Payrolls (NFP).
- In May, the US only added 75k jobs vs. 185k forecast.
- The prospects of a Fed’s rate cut is adding to the selling pressure.
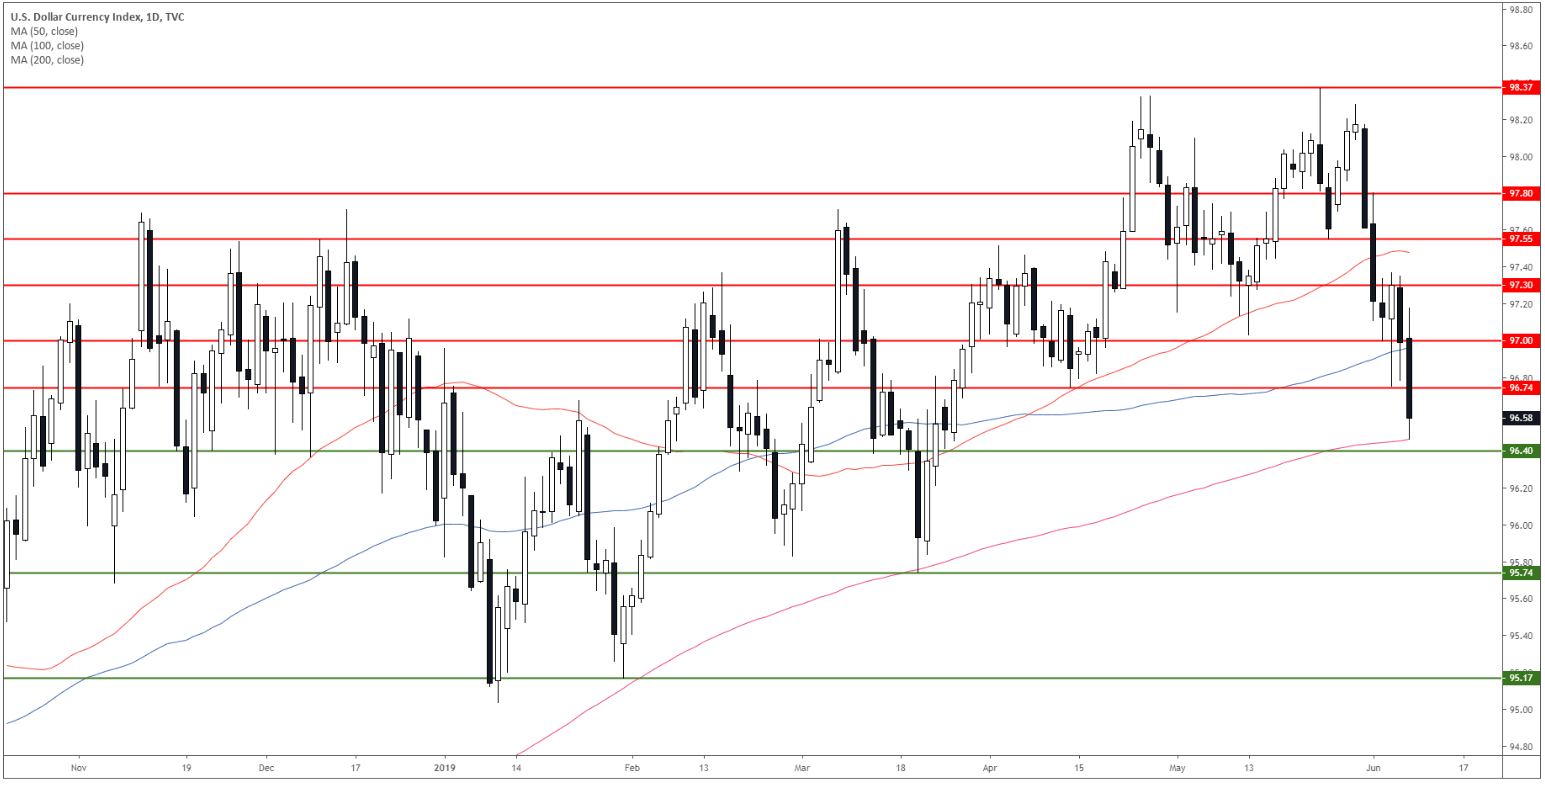
DXY daily chart
The US Dollar Index (DXY) is in a bull trend above its 200 simple moving averages (SMAs). The market is testing the 200 SMA.
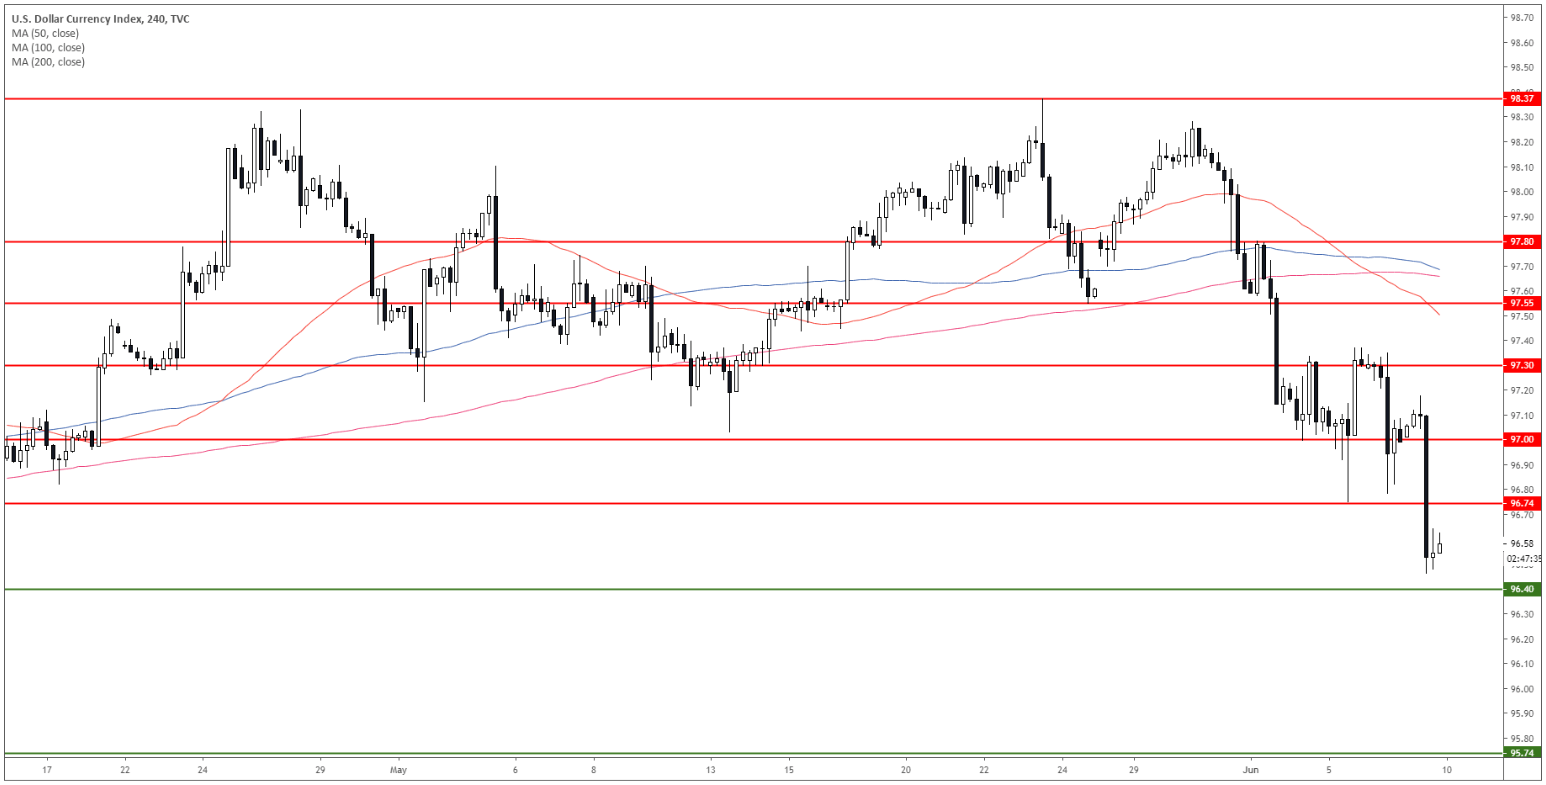
DXY 4-hour chart
DXY is under bearish pressure below 96.74 and its main SMAs. Bears will be looking for a break below 96.40. The market can be drifting down towards 95.74 and 95.17. Resistances are seen at 96.74 and 97.00
Additional key levels
