- Short-term trading range limits the momentum.
- 4H 200MA caps the upside with 8-week old horizontal-line likely being strong support.
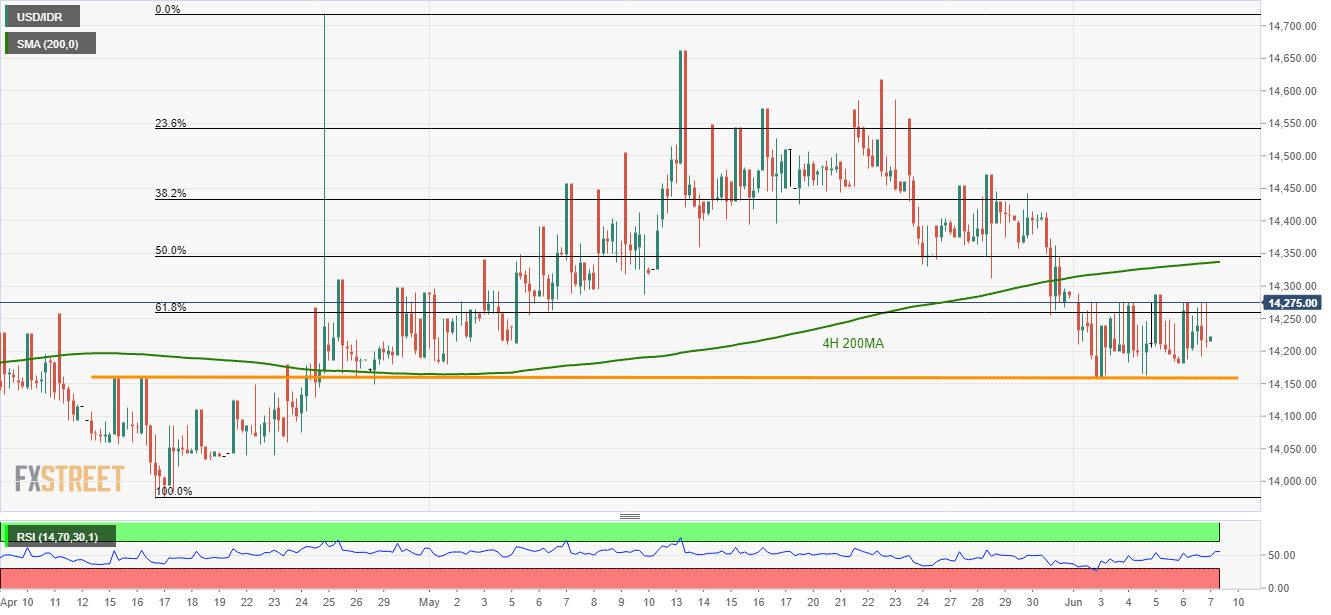
The USD/IDR pair holds its one-week old range intact as it trades near 14,275 pattern resistance during early Asian sessions on Monday.
With this, chances of the quote’s pullback to 14,180 seem brighter. However, a horizontal-line around 14,160/55 might confine further declines.
Given the price weakness under 14,155, 14,100, 14,030 and April month bottom surrounding 13,970 could become sellers’ favorites.
On the flipside, 200-bar moving average on the 4-hour chart (4H 200MA) becomes an important resistance near 14,340, a break of which can trigger fresh rise towards late-May high near 14,470.
Furthermore, pair’s sustained increase above 14,470 could set the stage for another set of high numbers flashed during the May month, surrounding 14,620 and 14,660.
USD/IDR 4-Hour chart
Trend: Pullback expected
