- The US and Mexico came up with a deal on tariffs and immigration, supporting the risk-on mood.
- The S&P500 is on a strong bullish run as bulls look at 2,893.00 and 2,940.00 to the upside.
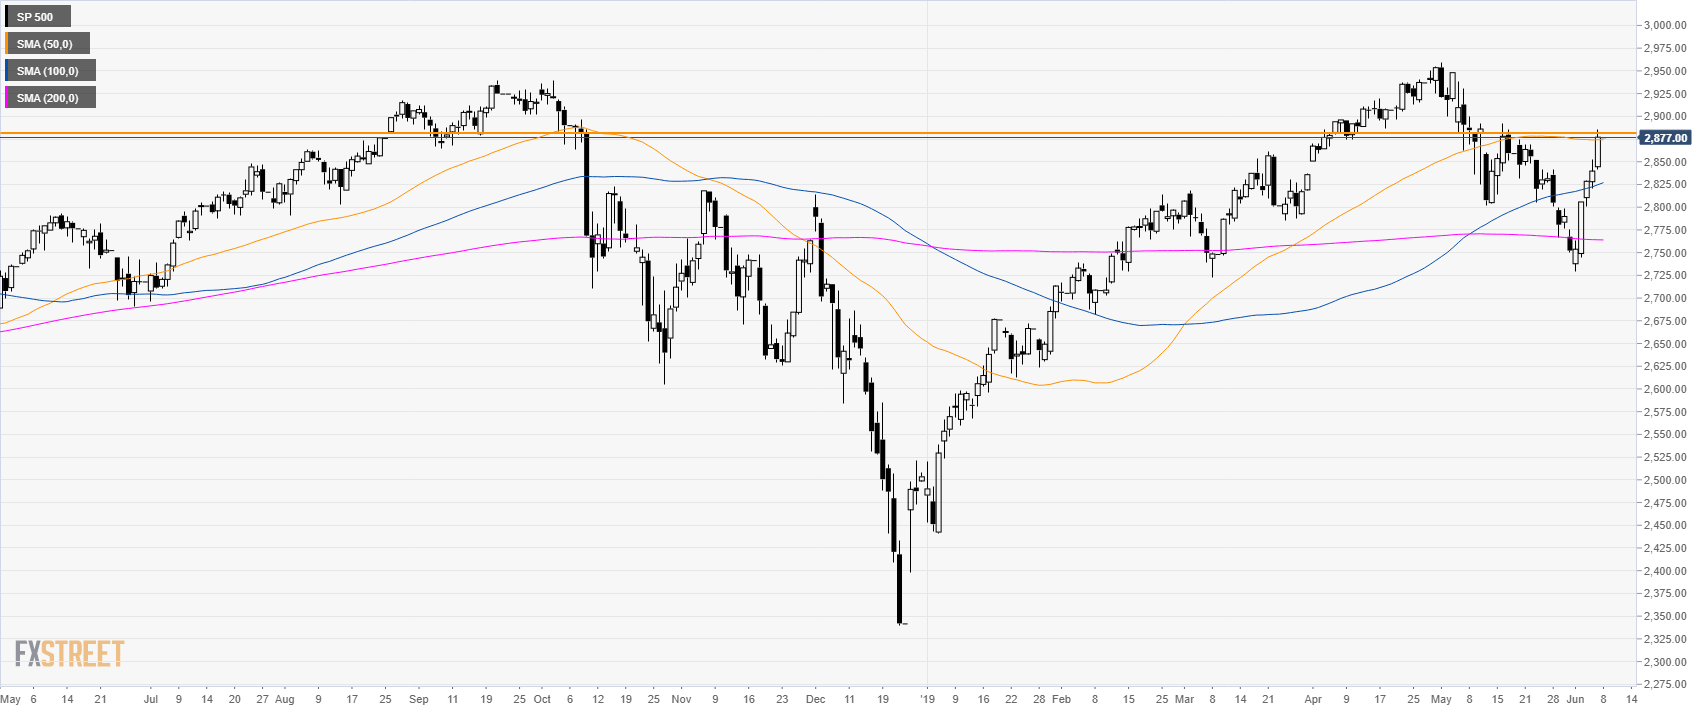
S&P500 daily chart
The S&P500 Index is up for the fifth consecutive day this Monday as the market is testing 2,880.00 and the 200-day simple moving average (DSMA).
S&P500 4-hour chart
The American stock index is under strong bullish pressure above its main SMAs. The path of least resistance remains to the upside with 2,893.00 and 2,940.00 as potential bull targets. Immediate support is at 2,870.00 and 2,840.00.
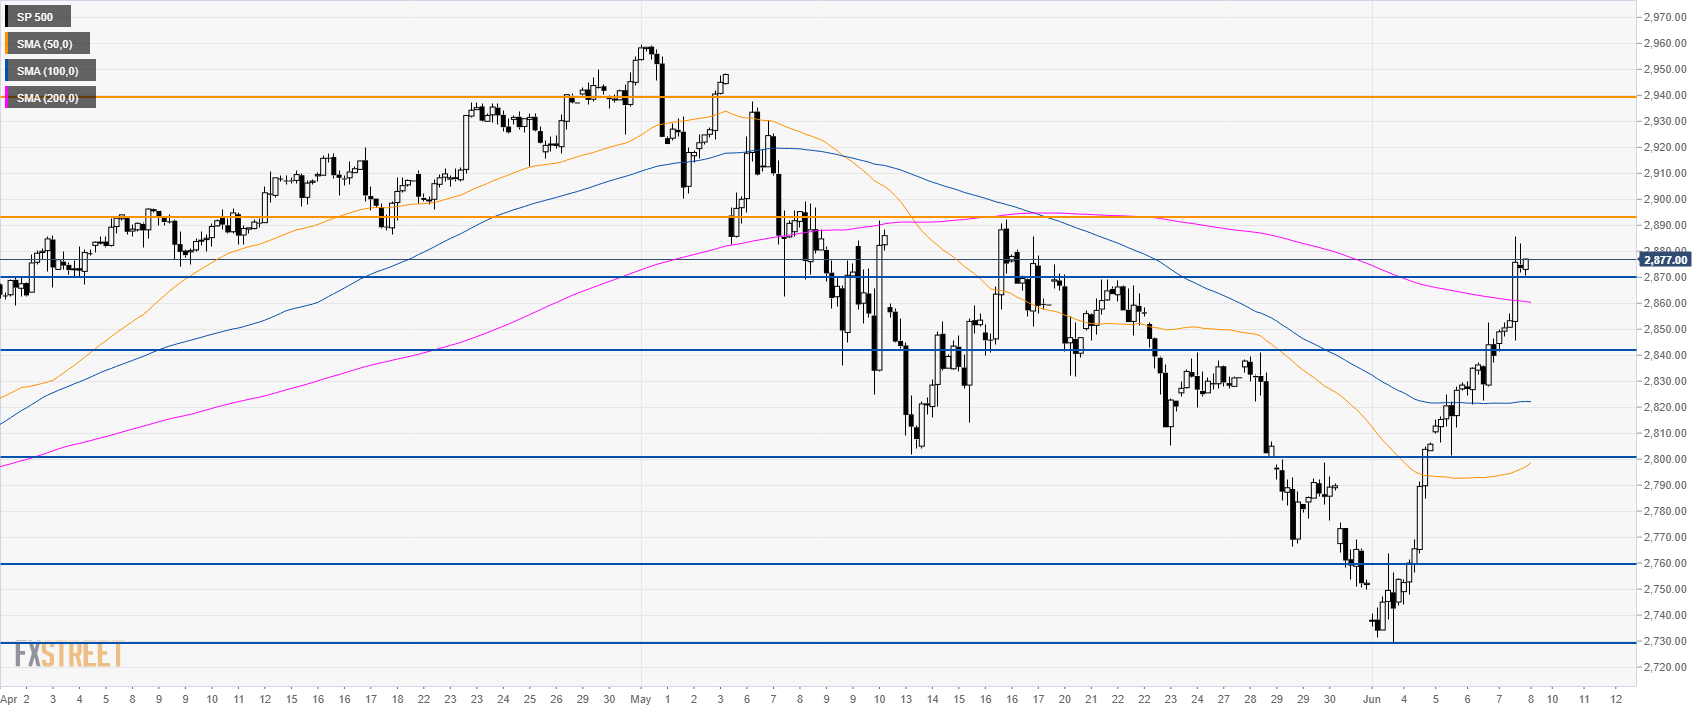
Additional key levels
