- DXY (US Dollar Index) is regaining some ground on the back of the risk-on mood. The deal between the US and Mexico on tariffs and immigration was seen as favorable for USD and equities.
- DXY bulls are not out of the woods just yet.
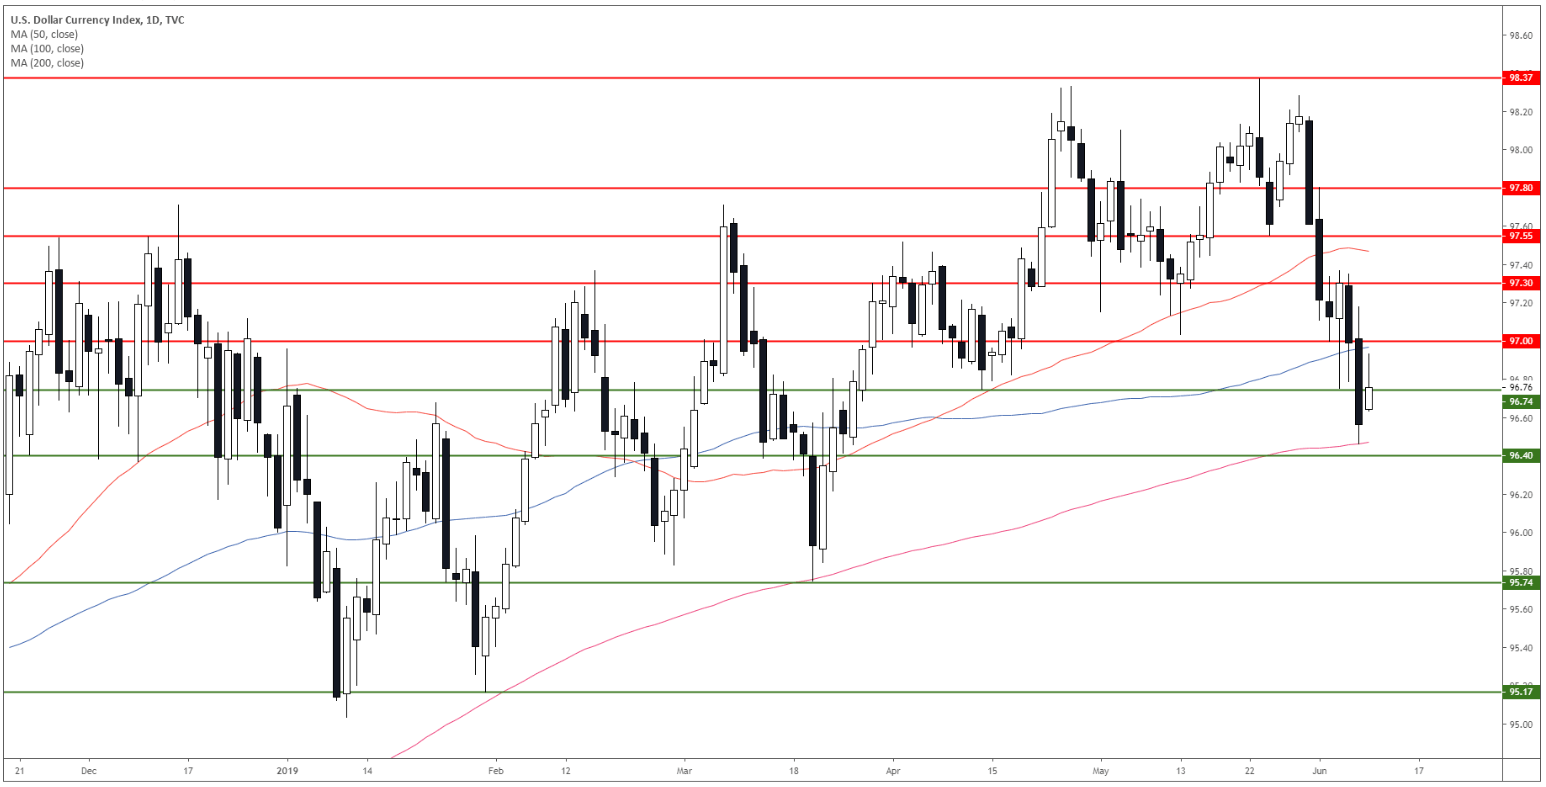
DXY daily chart
The US Dollar Index (DXY) is trading in a bull trend above 96.40 support and the 200-day simple moving averages (DSMA).
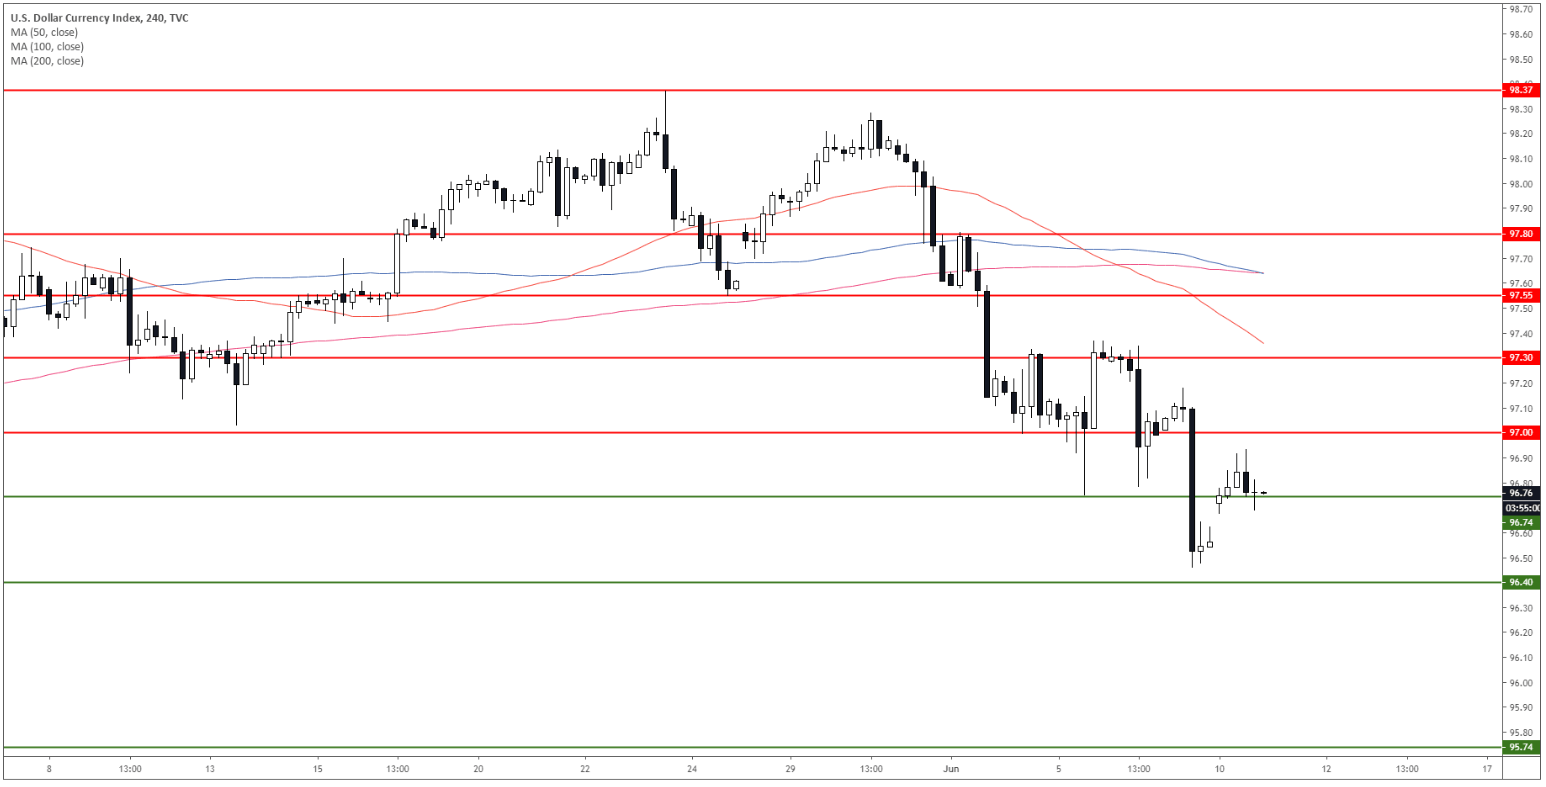
DXY 4-hour chart
DXY remains under bearish pressure below 97.00 and its main SMAs.
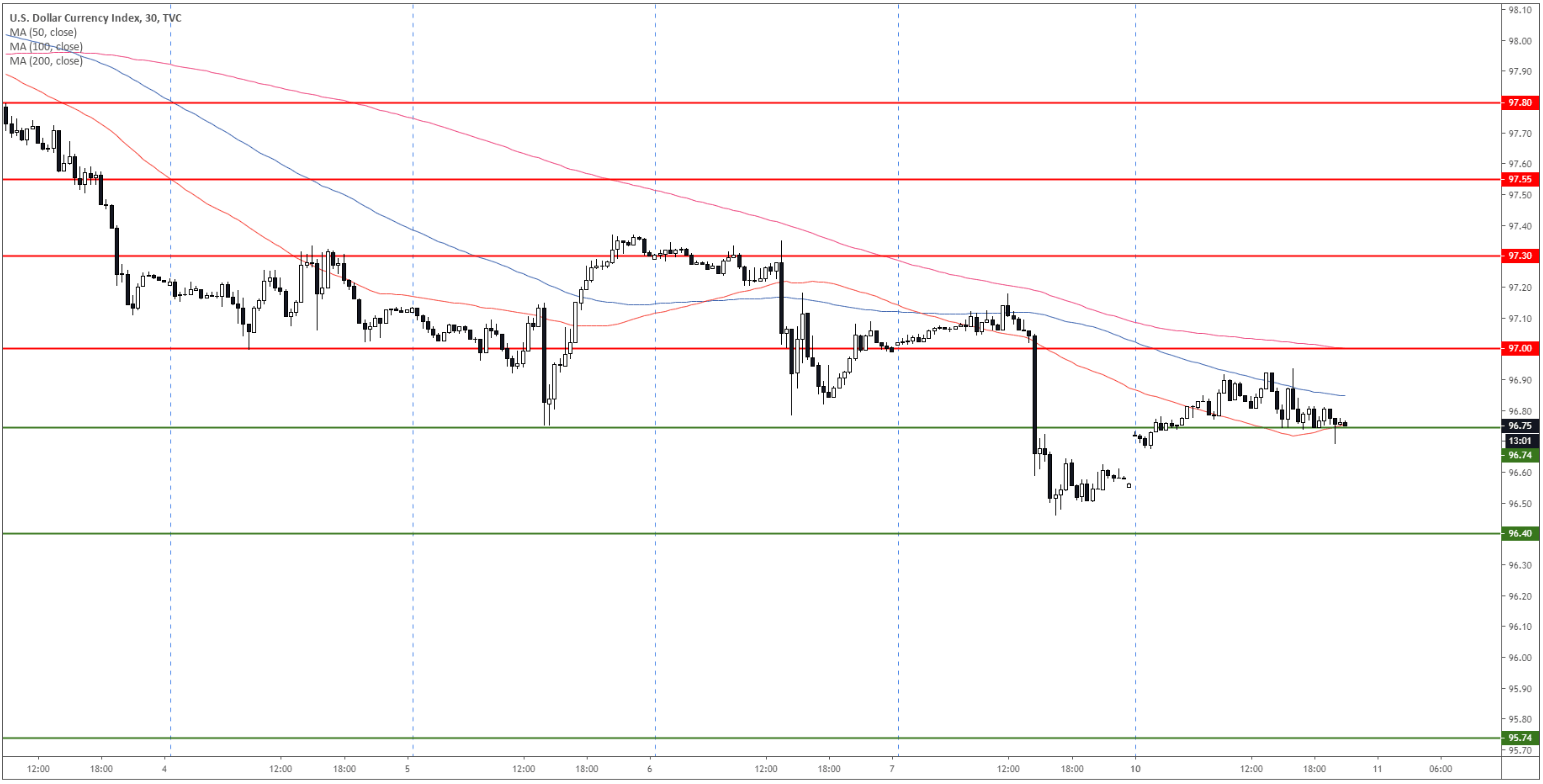
DXY 30-minute chart
DXY is trading below its main SMAs suggesting bearish momentum in the near term. Bears will be looking for a break below 96.74 support and a sustained drop below 96.40 to reach 95.74. Signs of a bullish recovery could be seen on a daily close above 97.00 and 97.30 resistances.
Additional key levels
