- A week-long trading range continues to limit the momentum.
- Sustained trading beyond 100-day SMA indicates the pair’s strength.
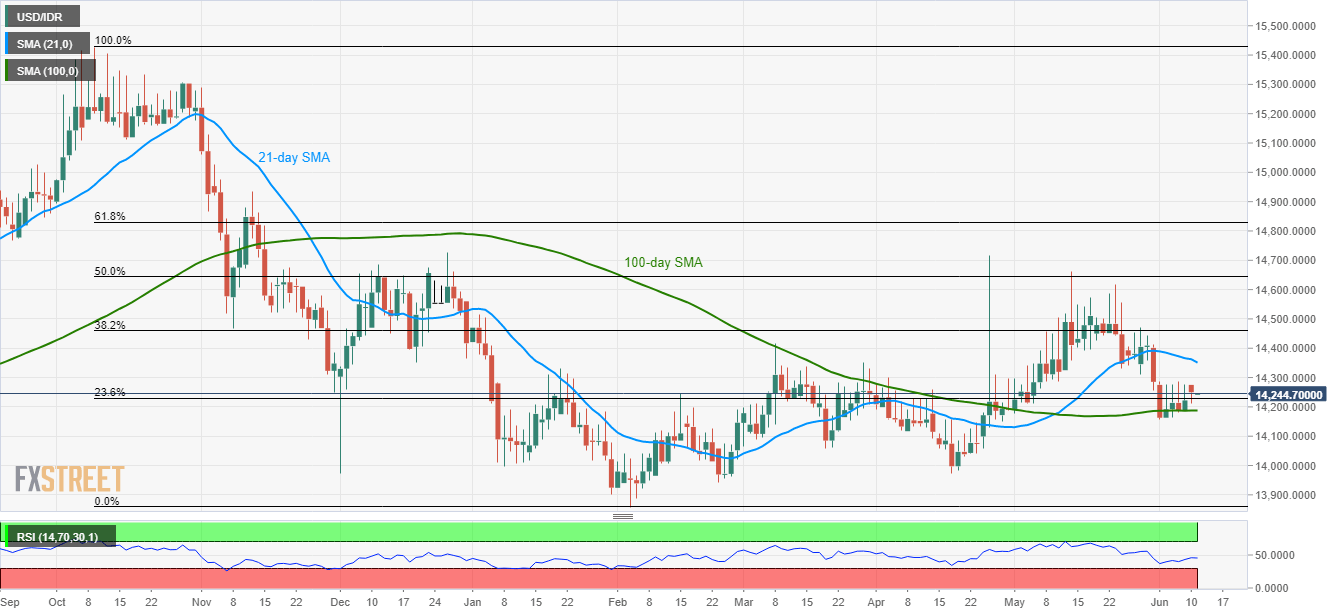
Having to witness another pullback from its short-term trading range, USD/IDR is presently close to 23.6% Fibonacci retracement support while taking the rounds near 14,244 during early Tuesday.
During the quote’s declines under 14,230 rest-points, 100-day simple moving average (SMA) level of 14,188 and a week-long range’s bottom around 14,160/55 could be on the sellers’ cards.
However, pair’s extended downpour past-14,155 might not refrain from visiting 14,120, 14,000 and April month low near 13,970.
Meanwhile, 14,290 is the range cap that could hold the pair momentum chained whereas 21-day SMA level of 14,350 could please buyers afterward.
In a case where prices rally beyond 14,350, 38.2% Fibonacci retracement of October 2018 to February 2019, at 14,460, might grab the spotlight.
USD/IDR daily chart
Trend: Sideways to bullish
