- Six-week-old horizontal-resistance restricts near-term upside.
- 4H 200MA back in focus for sellers.
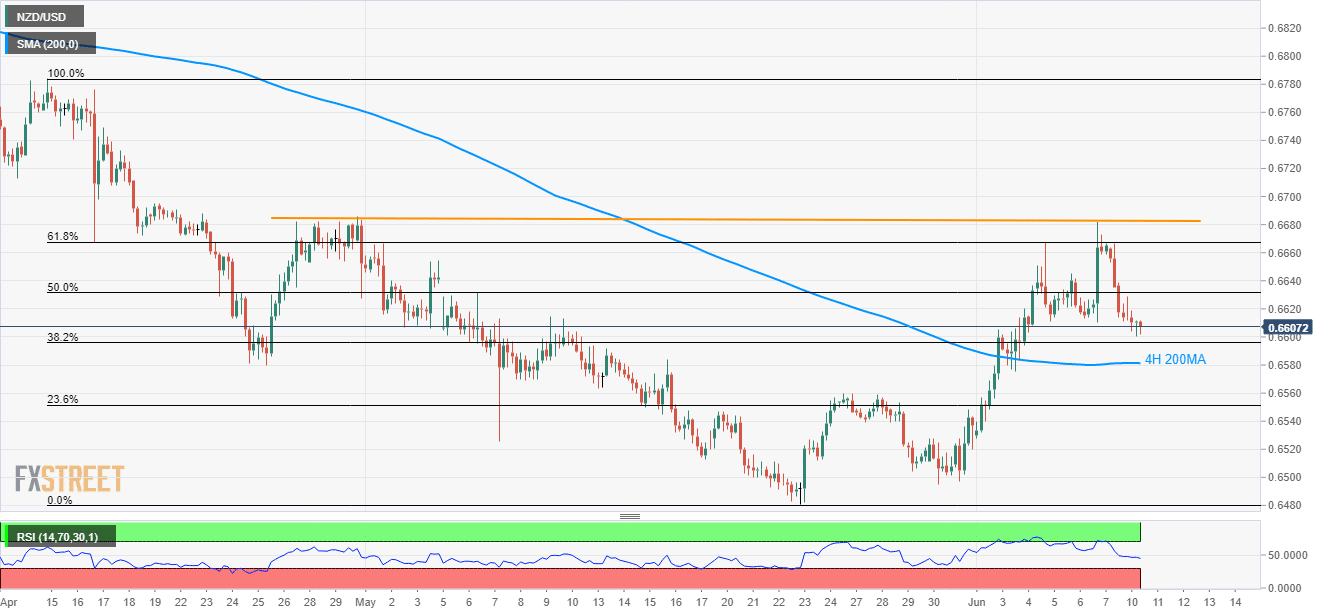
The pullback from six-week tops once again highlights the importance of 200-MA for NZD/USD traders as it drops to 0.6607 during early Tuesday.
Should the pair slips under 200-bar moving average (4H 200MA) level of 0.6580, 0.6560, 0.6530 and 0.6500 are likely following numbers to appear on the chart if 14-bar relative strength index (RSI) continues to support the momentum.
If bears dominate trading sentiment past-0.6500, 0.6480 and October 2018 low near 0.6460 might flash as quotes.
On the flipside, 61.8% Fibonacci retracement of mid-April to a late-May downturn at 0.6670 can limit the pair’s immediate advances ahead of diverting buyers towards 0.6680/85 horizontal-resistance.
Further, the pair’s successful trading above 0.6685 opens the door for its northward trajectory to 0.6700 and 0.6750 levels.
NZD/USD 4-Hour chart
Trend: Bearish
