- EUR/GBP clinches fresh tops in the 0.8930 earlier in the day.
- GBP trades on a firm note in the wake of UK data.
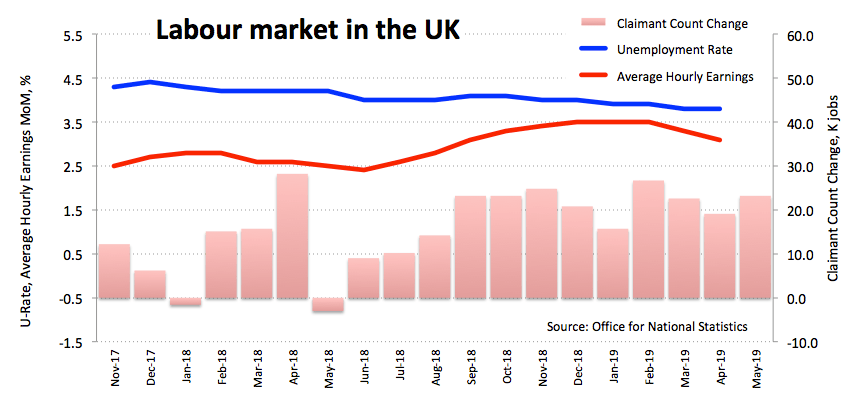
- UK wage growth surprised to the upside during April.
The now positive performance of the Sterling is putting EUR/GBP under some selling pressure, forcing it to recede from earlier 5-month tops in the 0.8930/35 band.
EUR/GBP weaker post-UK jobs
Despite the retreat from new multi-month tops in the 0.8930 region, the European cross keeps the positive ground so far this week, advancing uninterruptedly since sub-0.8500 levels recorded in early May.
Today’s current knee-jerk comes in response to the pick up in the demand for the British Pound, in turn supported by an auspicious UK labour market.
In fact, while Claimant Count Change rose by 23.2K in May (vs. 22.9K forecasted), Average Earnings +Bonus rose more than expected 3.1% in April, the Employment Change ticked higher by 32.0K jobs and the jobless rate stayed put at 3.8%.
On the Brexit front, French officials ruled out a revision of the current withdrawal agreement; while back to UK politics, former London mayor and Brexiteer Boris Jonhson appears to be leading the race to succeed Theresa May at Number 10.
Closer to home, EMU Sentix index dropped to -3.3 for the month of June.
What to look for around GBP
Heightened uncertainty around the Brexit negotiations and May’s successor keeps the pressure on the Sterling intact for the time being. In the UK economy, today’s better-than-expected labour market report have given some wings to the British Pound, although the bull run should be short-lived. Additionally, the current steady stance from the Bank of England appears justified by below-target inflation figures, downbeat results from key economic fundamentals and somewhat slowing momentum in wage inflation pressures, all adding to speculations of a ‘no-hike’ this year despite some calls signalling a potential hike in November.
EUR/GBP key levels
The cross is losing 0.15% at 0.8903 and faces initial contention at 0.8826 (low Jun.5) seconded by 0.8780 (200-day SMA) and finally 0.8724 (low May 21). On the other hand, a break above 0.8932 (monthly high Jun.11) would expose 0.9062 (low Jan.11) and finally 0.9092 (2019 high Jan.3).