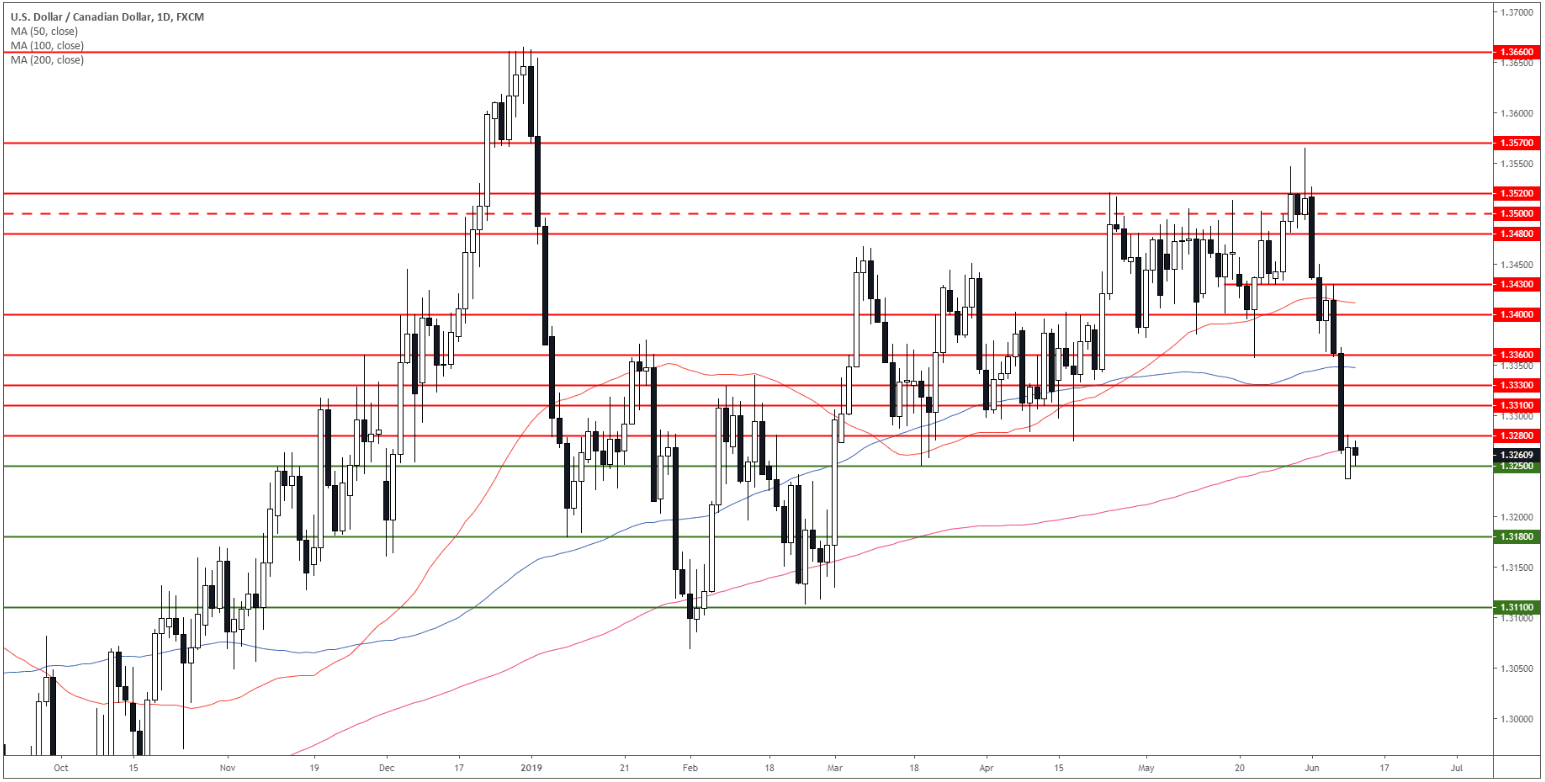
- USD/CAD is challenging the 200-day simple moving averages (DSMAs).
- A break below 1.3250 can potentially lead to further losses.
USD/CAD daily chart
The market is testing 1.3250 and the 200 simple moving averages (DSMAs).
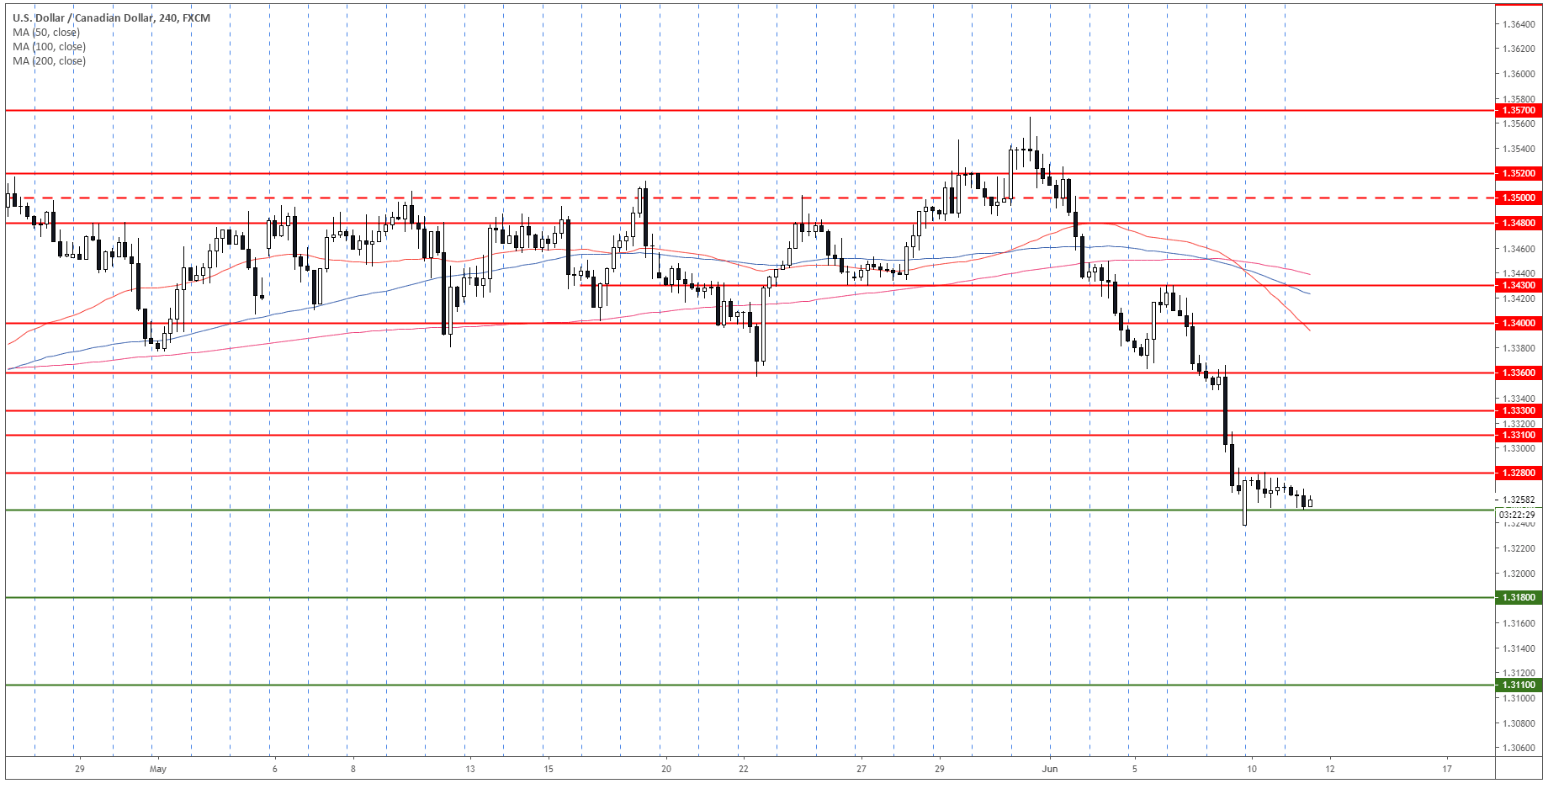
USD/CAD 4-hour chart
USD/CAD is under bearish pressure below its main SMAs.
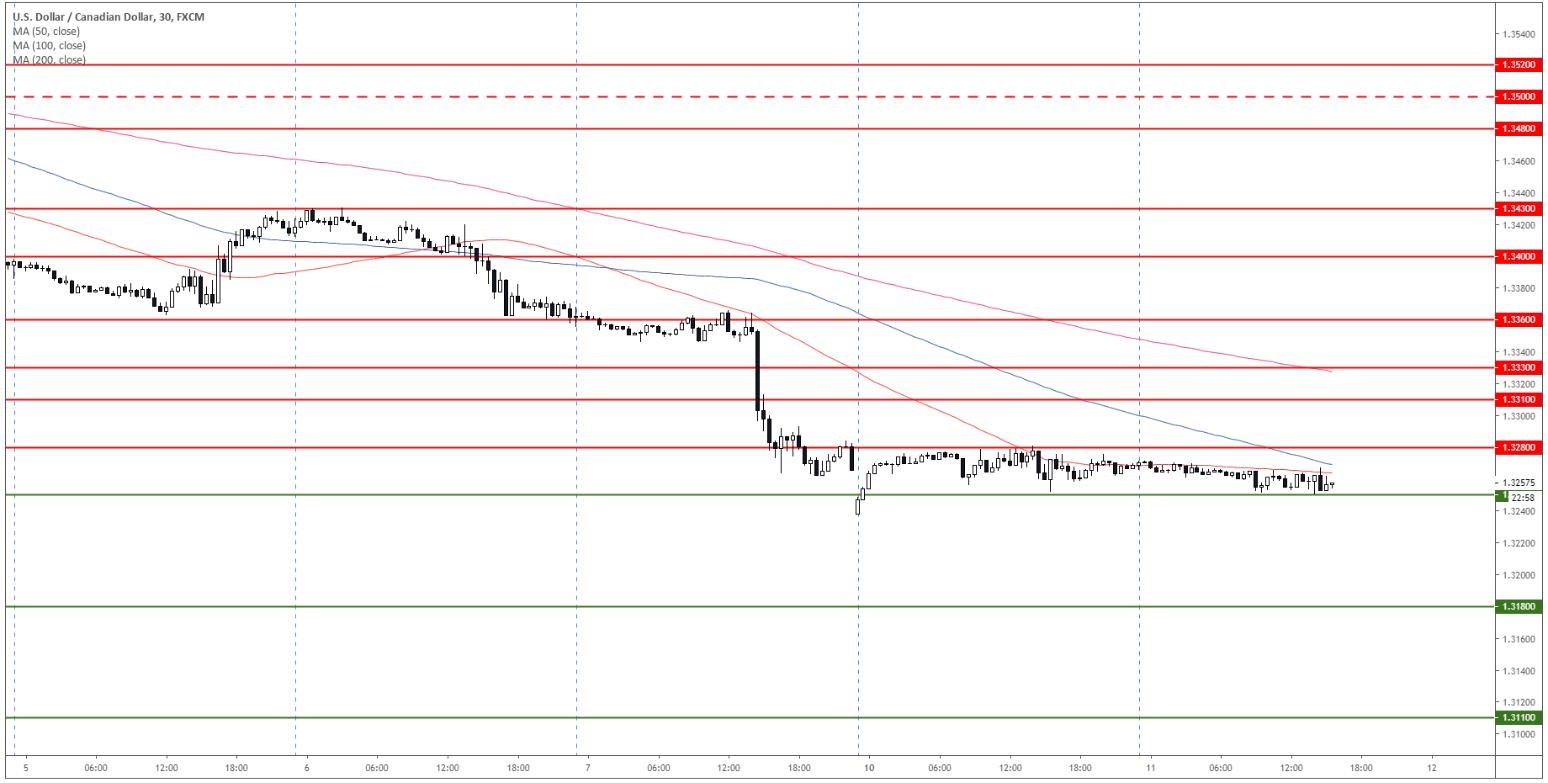
USD/CAD 30-minute chart
The currency pair is trading in a tight range below its main SMAs suggesting a bearish bias in the short term. A breakdown below 1.3250 can lead the market to 1.3180 and 1.3110 to the downside. Resistance is seen at 1.3280, 1.3310 and the 1.3300 levels.
Additional key levels
