- EUR/USD has been struggling to gain ground despite USD weakness.
- Concerns about trade and speculation about the next central bank moves are set to dominate.
- Thursday’s four-hour chart suggests the tables are turning against the pair.
When a currency pair is unable to gain on positive news, it exposes its weakness – and that is EUR/USD’s case. US core consumer prices have risen by only 0.1% on a monthly basis and .2.0% year on year in May, weaker than expected. Moreover, the data contradicts the Federal Reserve’s assertion that poor inflation in the first quarter was only transitory. Pressures on the Fed to cut interest rates are mounting – weighing on the US dollar.
However, after a short-lived rise, EUR/USD has retreated from the highs and even dropped to lower ground – showing that its upside momentum has been exhausted. Additional adverse developments weighed on the currency pair later.
President Donald Trump may be behind the extended slide. Apart from the intensifying trade war with China, Trump has been clashing with Germany on the Nord Stream 2 pipeline. The 917-kilometer, multi-billion euro project – which has caused various controversies – arguably make Europe’s largest economy more reliant on Russian gas supplies. In response, he aims to reduce the number of American troops in Germany and shifting some to Poland. Worries about the German economy have grown – weighing on the common currency.
The old continent suffers from internal tensions as well. Italy remains under scrutiny for breaching the budget goals set by the European Commission and finance minister Giovanni Tria may be barraged in the Eurogroup – a gathering of euro-zone finance ministers held today in Luxembourg.
The economic calendar features euro-zone industrial output and weekly jobless claims – both low-tier indicators – leaving the scene to trade tensions and speculation about next week’s all-important Fed meeting.
EUR/USD Technical Analysis
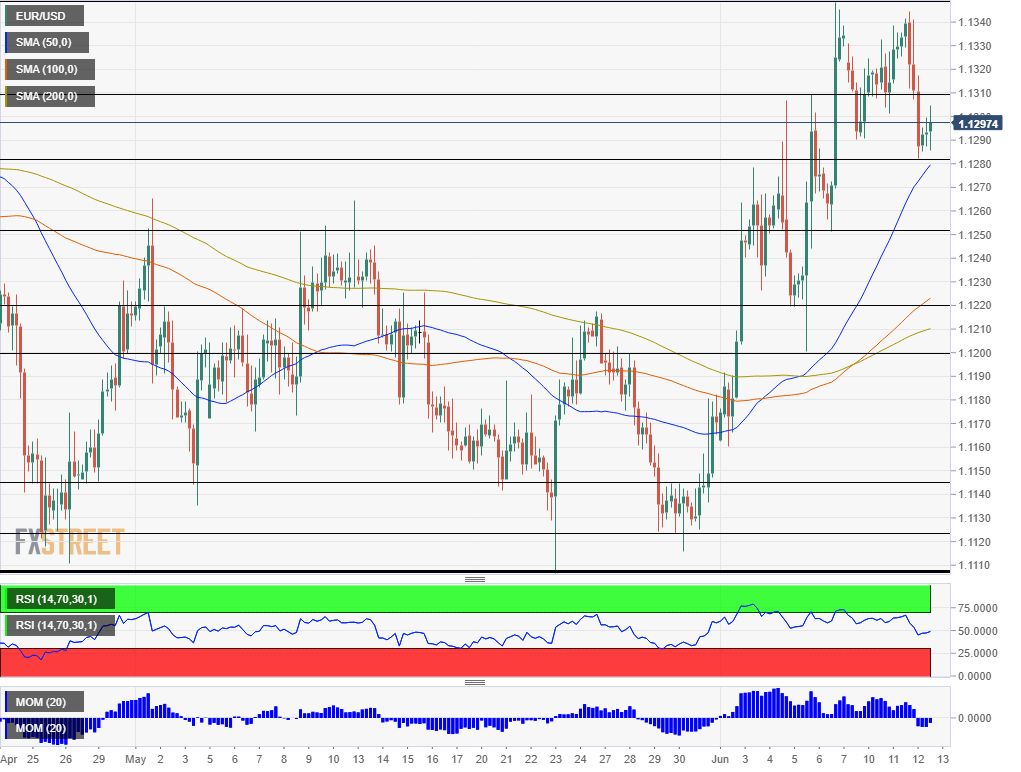
Momentum on the four-hour chart has turned negative but EUR/USD still enjoys the support of the 50 Simple Moving Average – albeit perhaps not for long – as it is getting close. The 50 SMA converges with today’s low of 1.1285, making it a critical line of support.
Further down, we find 1.1250, which was a swing low in early June, followed by 1.1220 that capped the pair in late May and 1.1200 – the post ECBtrough.
Immediate resistance awaits at 1.1310 that held EUR/USD down last week, 1.1348 which is the 11-week high reached on Friday, and 1.1395 which dates back to late March.
