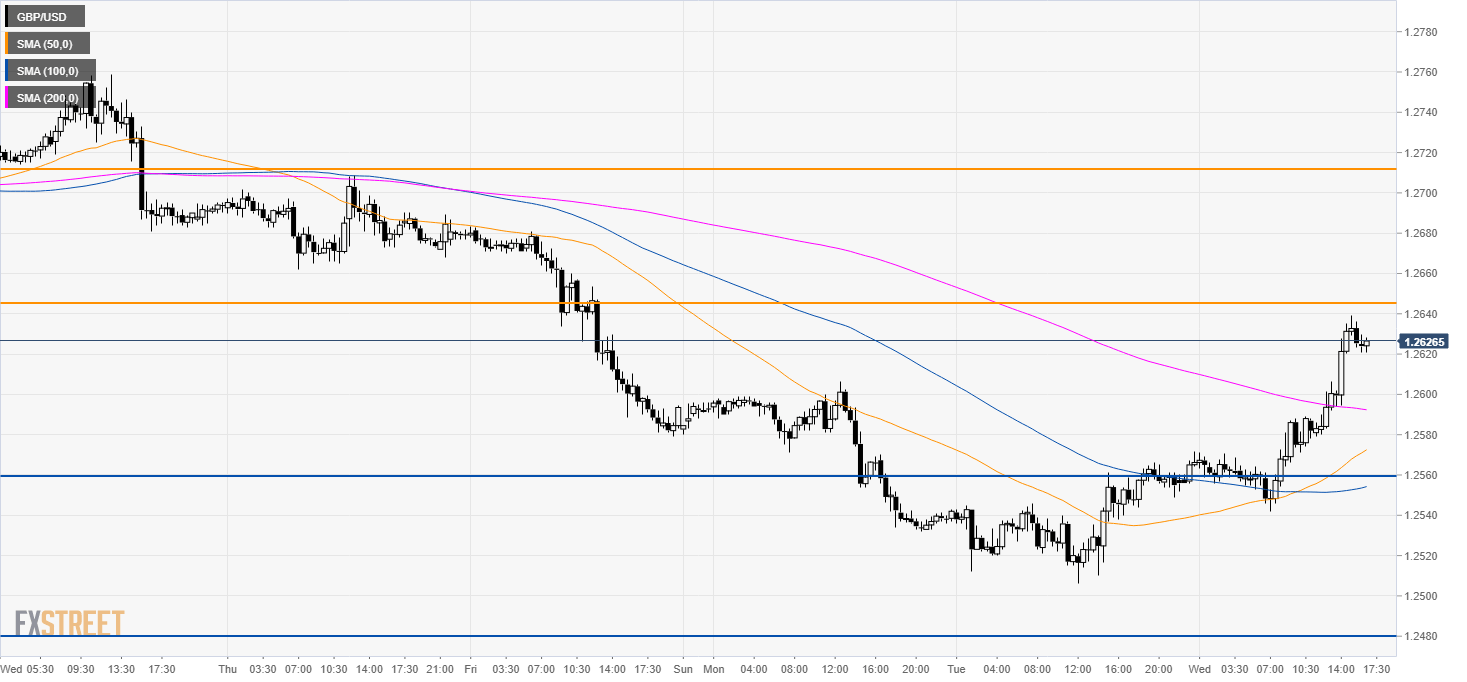
- GBP/USD is trading just below 1.2645 strong resistance.
- GBP/USD is turning bullish as the market is trading at fresh weekly highs.
Cable has been appreciating ahead of the release of the FOMC report. Market participants will be on the lookout for any hints from the Federal Reserve regarding interest rates policy.
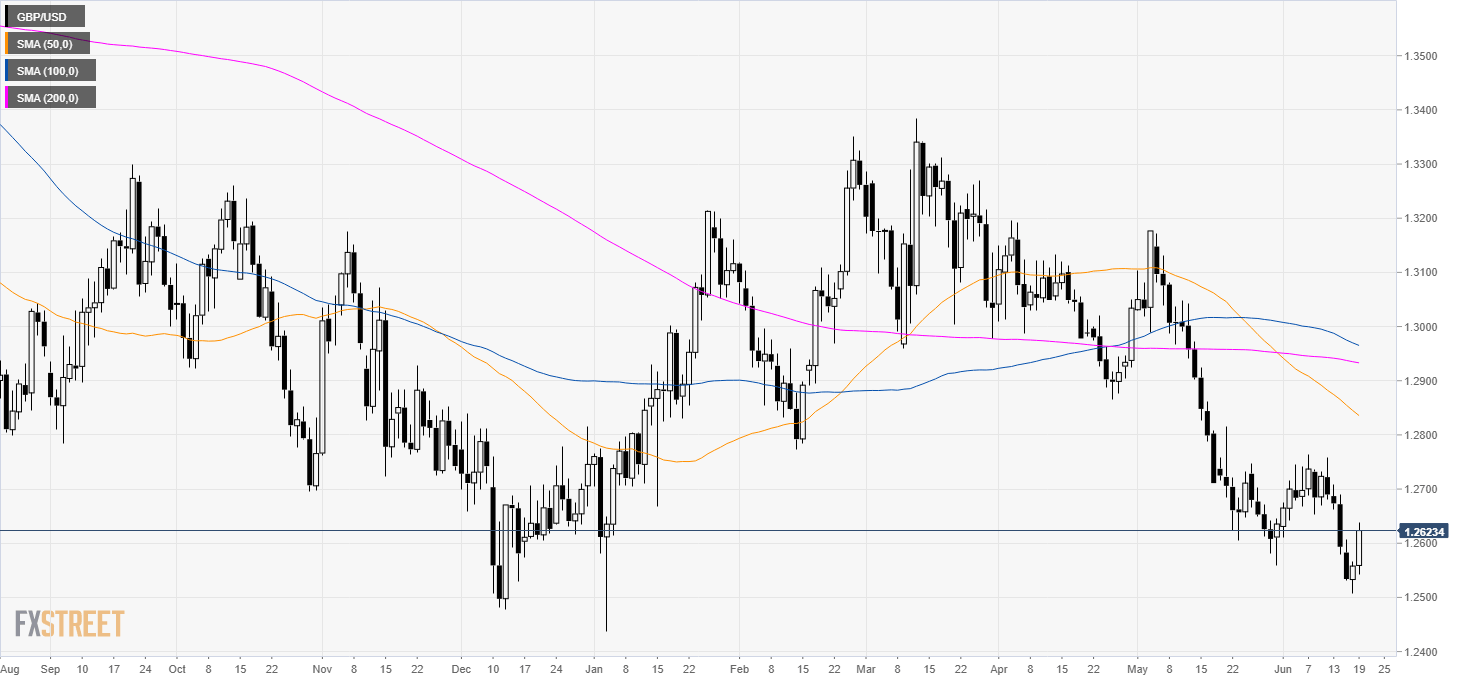
GBP/USD daily chart
GBP/USD is in a bear trend below its main simple moving averages. The market has been rebounding sharply from 1.2500 figure gaining more than a 100 pips since Tuesday.

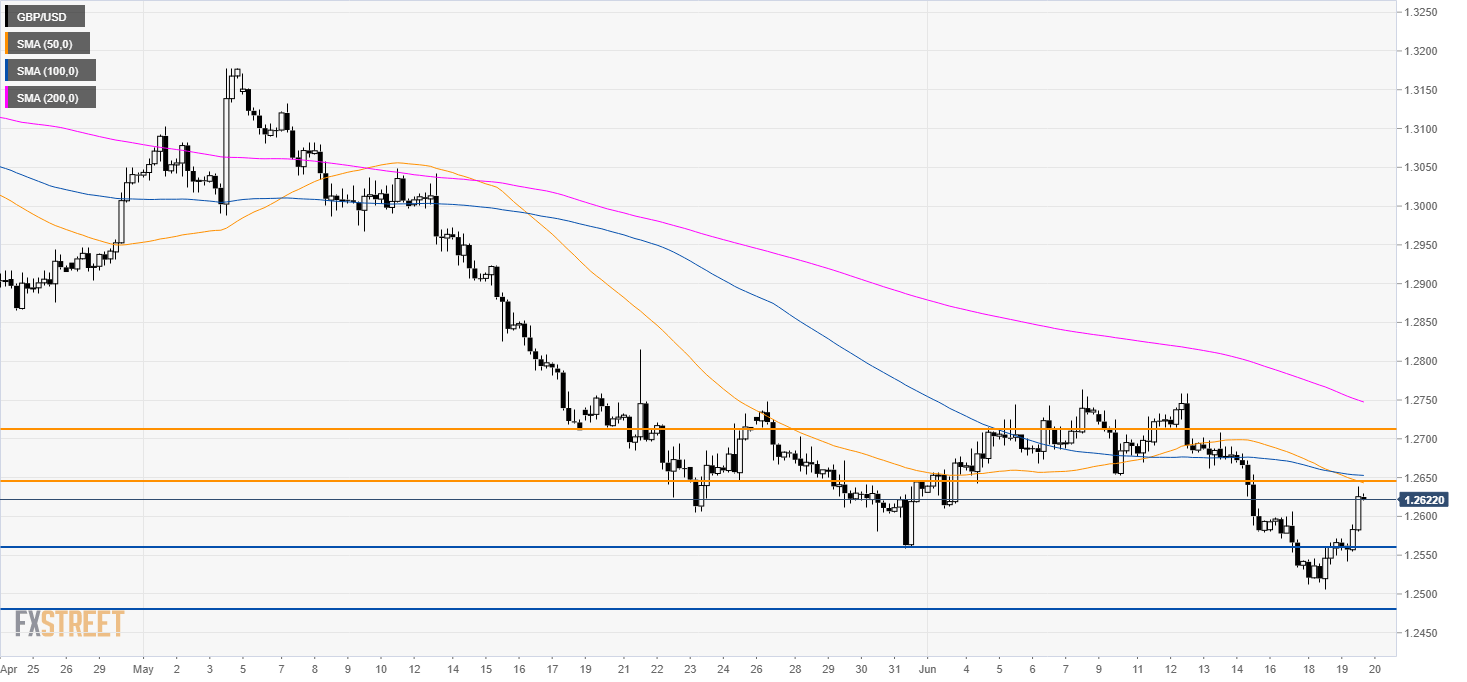
GBP/USD 4-hour chart
The market almost reached 1.2645 which is a strong resistance according to the Technical Confluences Indicator. If broken Cable can pop to 1.2712. To the downside, the market can find support at 1.2560 and 1.2480 level.
GBP/USD 30-minute chart
GBP/USD is trading above its main SMAs suggesting a bullish bias in the short term. The 1.2645 level is seen as strong resistance and there seems to be little resistance to 1.2712 if the market breaks to the upside.
Additional key levels
