- The S&P500 hits a new all-time high at 2,960.00.
- If the bulls break 2,960.00 resistance the next target can be at 3,000.00.
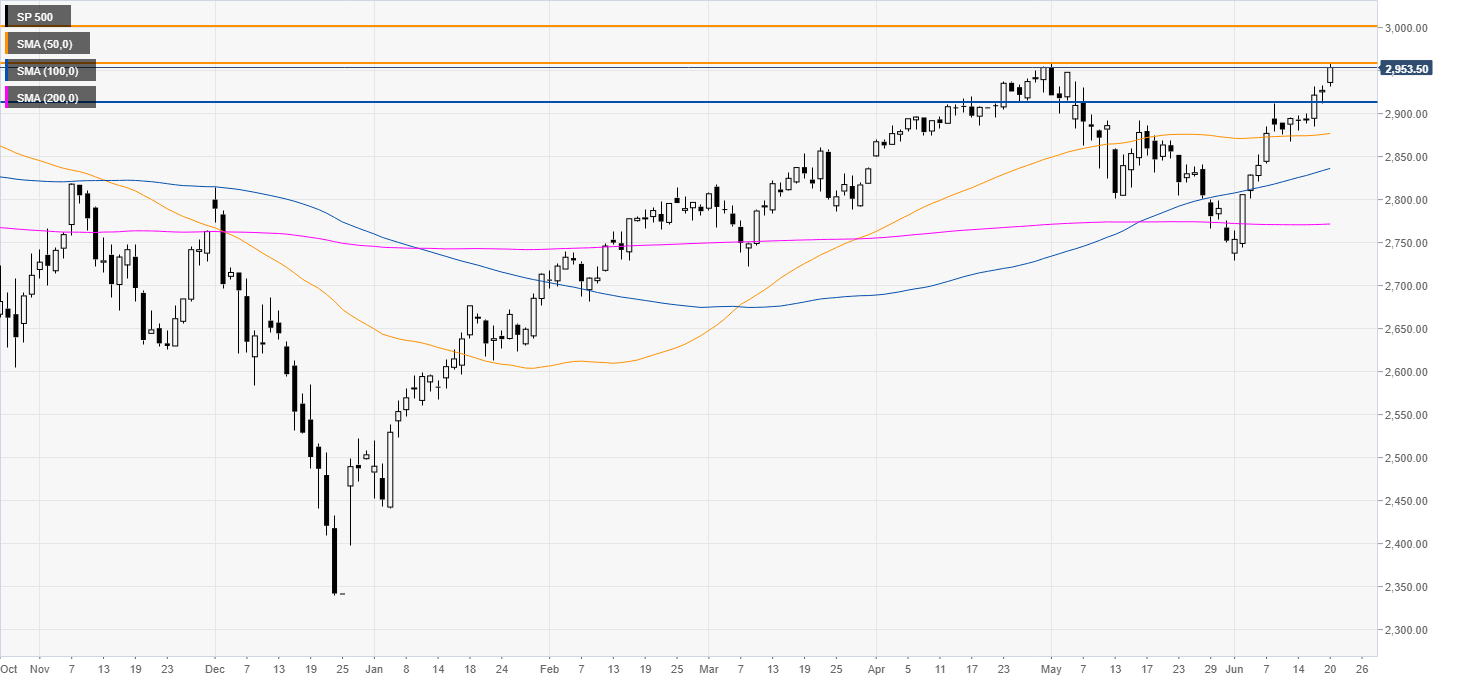
S&P500 daily chart
The S&P500 fit 2,960.00 a new all-time high this Thursday. The market remains bullish above the main daily simple moving averages (DSMAs).
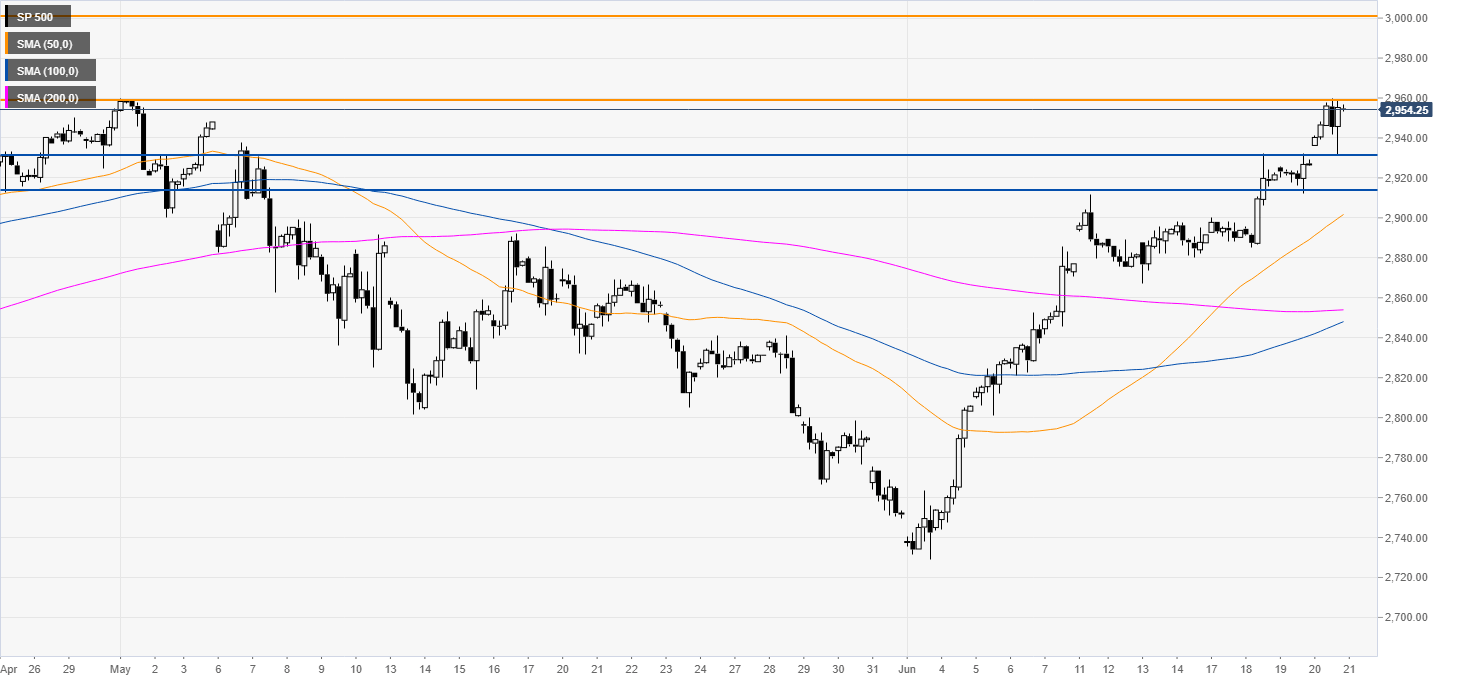
S&P500 4-hour chart
The stock index is trading above its main SMAs suggesting bullish momentum in the medium term. The 50 SMA crossed above the 200 SMA which is a bullish sign. A sustained break above 2,960.00 can lead to 3,000.00. Immediate support can be located at 2,930.00 and 2,910.00.
Additional key levels
