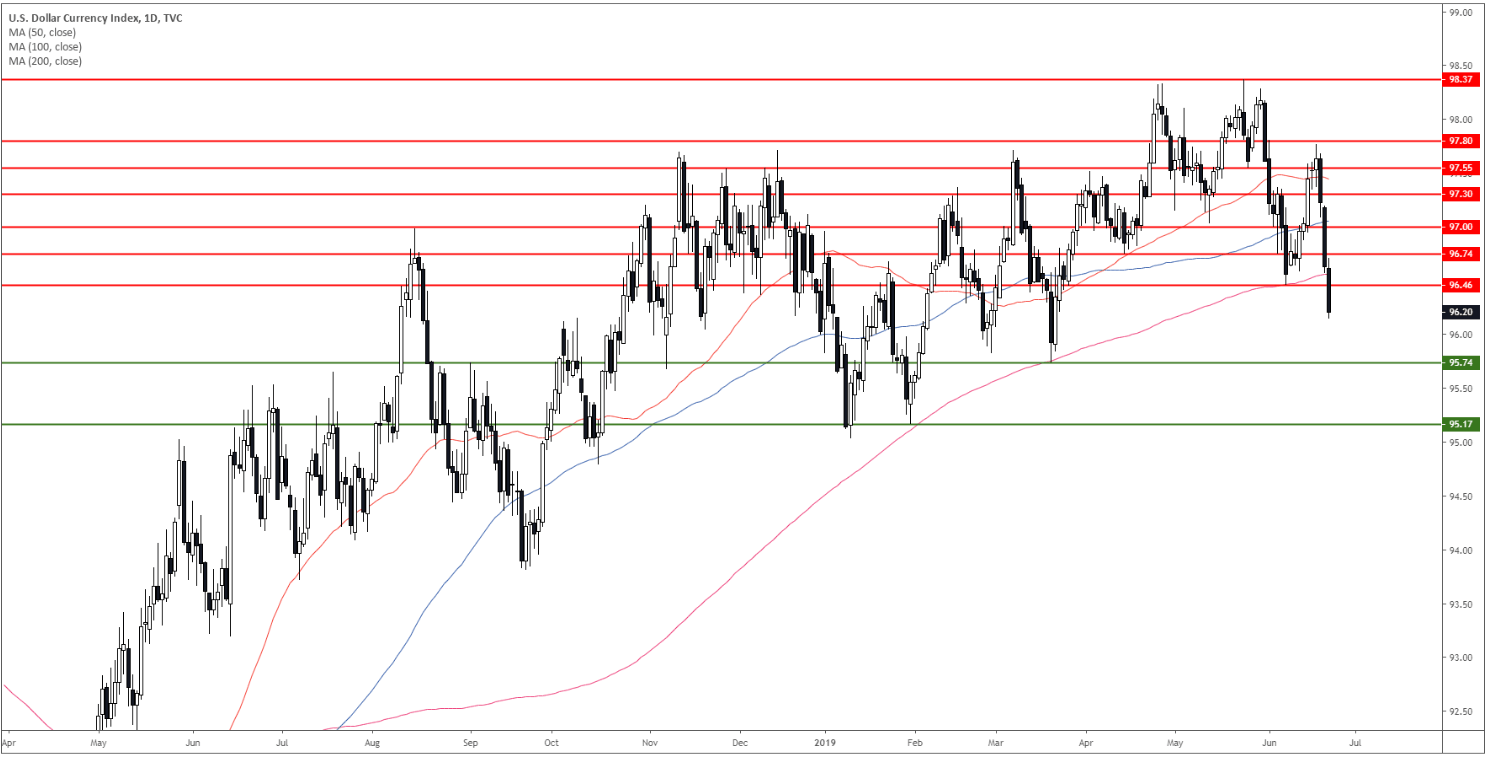
- The bull trend might be in peril as bears brroke below a key support and the 200 DSMA.
- Targets to the downside can be seen at 95.74 and 95.17.
DXY daily chart
The US Dollar Index (DXY) broke below 96.46 key support and its 200-day simple moving average (DSMA) suggesting that the bull trend might start to fizzle out.

DXY 4-hour chart
DXY is trading below its main SMAs suggesting bearish momentum in the near term. Bears can reach 95.74 and 95.17 to the downside. Resistance is at 96.46 and 69.74. .
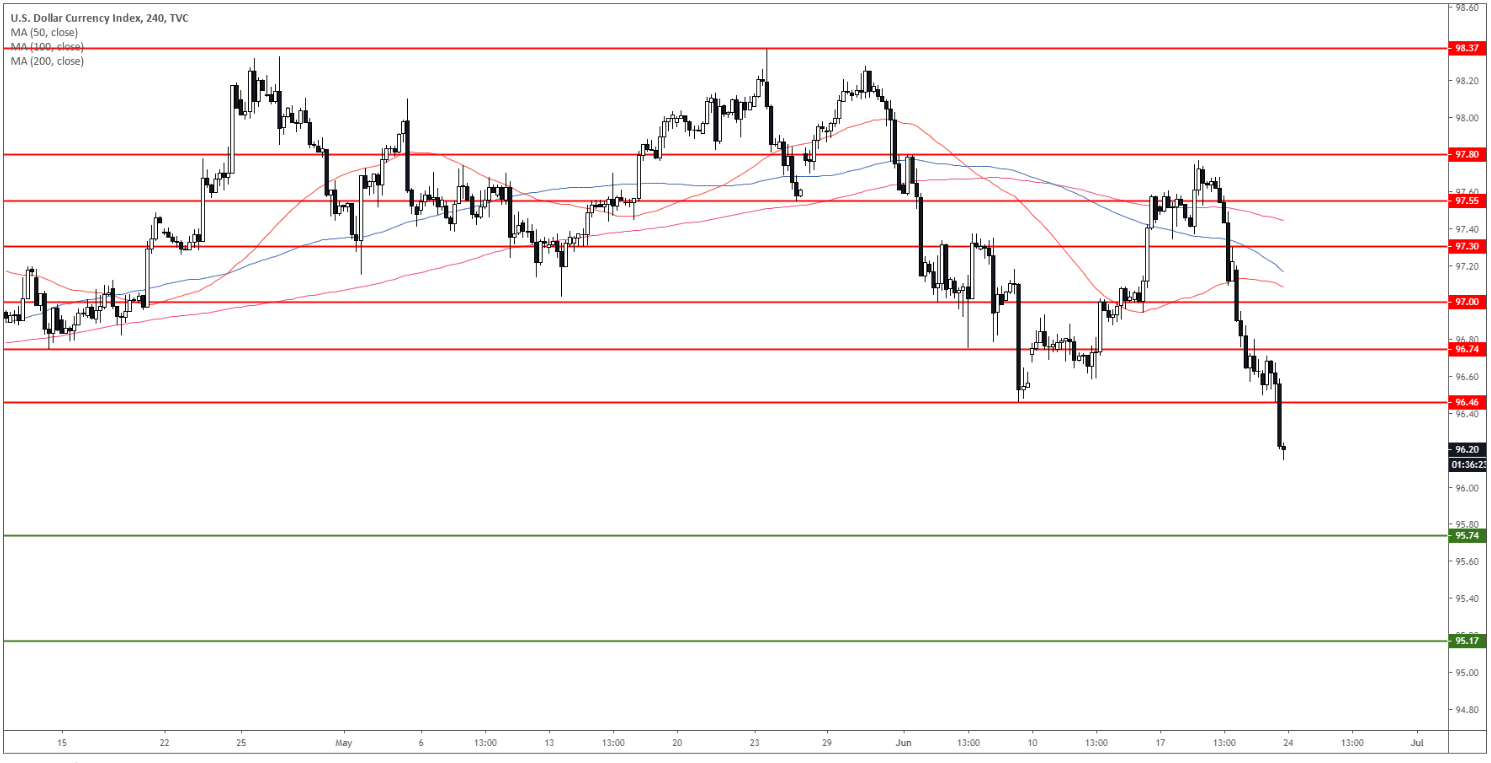
Additional key levels
