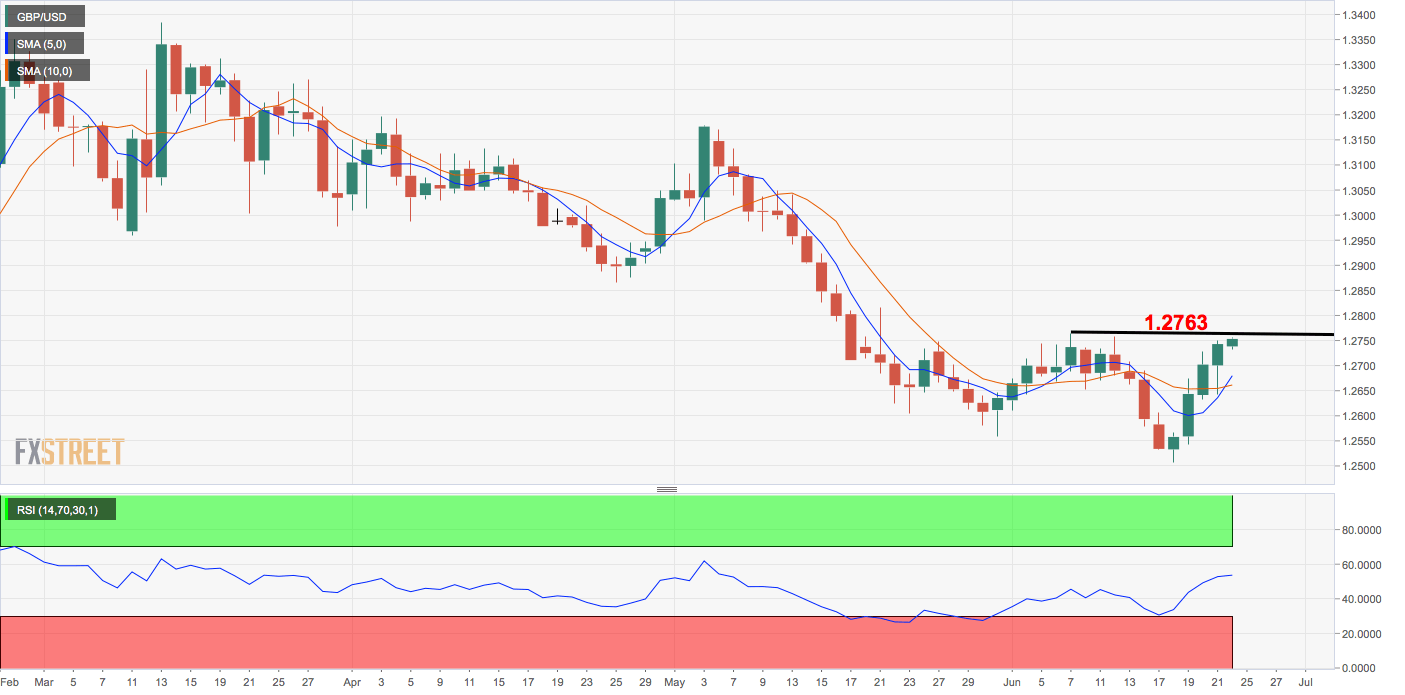
- GBP/USD is flashing green for fifth consecutive day.
- A close above 1.2763 would invalidate bearish lower highs pattern.
- The 14-day RSI is biased bullish.
GBP/USD is trading on a positive note for the fifth straight day and is on track to test resistance at 1.2763 (June 7 high).
A daily close above that level would invalidate bearish lower highs pattern and validate the bearish-to-bullish trend change signaled by pair’s recovery from 1.2506 to current rate of 1.2754, bullish crossover of the 5- and 10-day moving averages and 14-day relative strength index’s (RSIs) move above 50.00.
A bullish close, if confirmed, would open the doors to former support-turned-resistance of 1.2866 (April 25 low). On the way higher, the pair may face resistance at the descending (bearish) 50-day moving average, currently at 1.2813.
The bullish case would weaken if the pair violates the bullish higher lows pattern on the hourly chart with a move below 1.2642.
Daily chart
Trend: Bullish
Pivot points
