- USD/CAD is consolidating the losses seen last week.
- 1.3232 can be initial resistance on the way up.
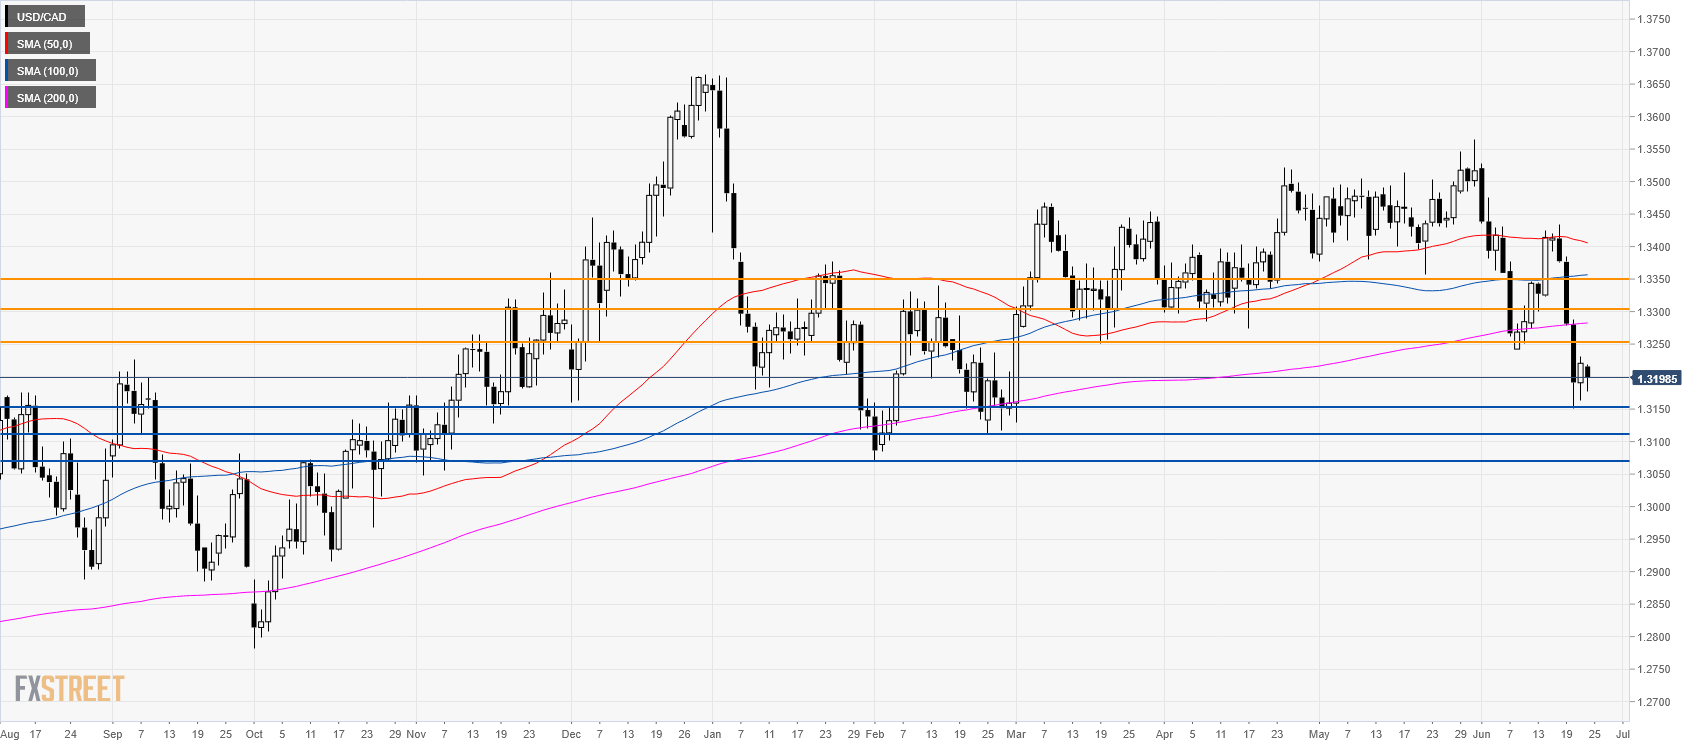
USD/CAD daily chart
Last week, USD/CAD dropped below the 1.3200 figure and the main daily simple moving average (DSMA).

USD/CAD 4-hour chart
USD/CAD is consolidating its losses below its main SMAs. Bears need to break below 1.3150 (last week low) to reach 1.3120 and 1.3084 swing lows.

USD/CAD 30-minute chart
-636969851144938026.png)
The market is trading within Friday’s range as the 50 SMA crossed above the 100 SMA suggesting a correction up in the near term. Resistances are seen at 1.3232, 1.3310 and 1.3345, according to the Technical Confluences Indicator.
-636969851891661623.png)
Additional key levels
