- Gold is unstoppable as bulls break to multi-year highs.
- The level to beat for buyers is $1,433.82 per troy ounce.
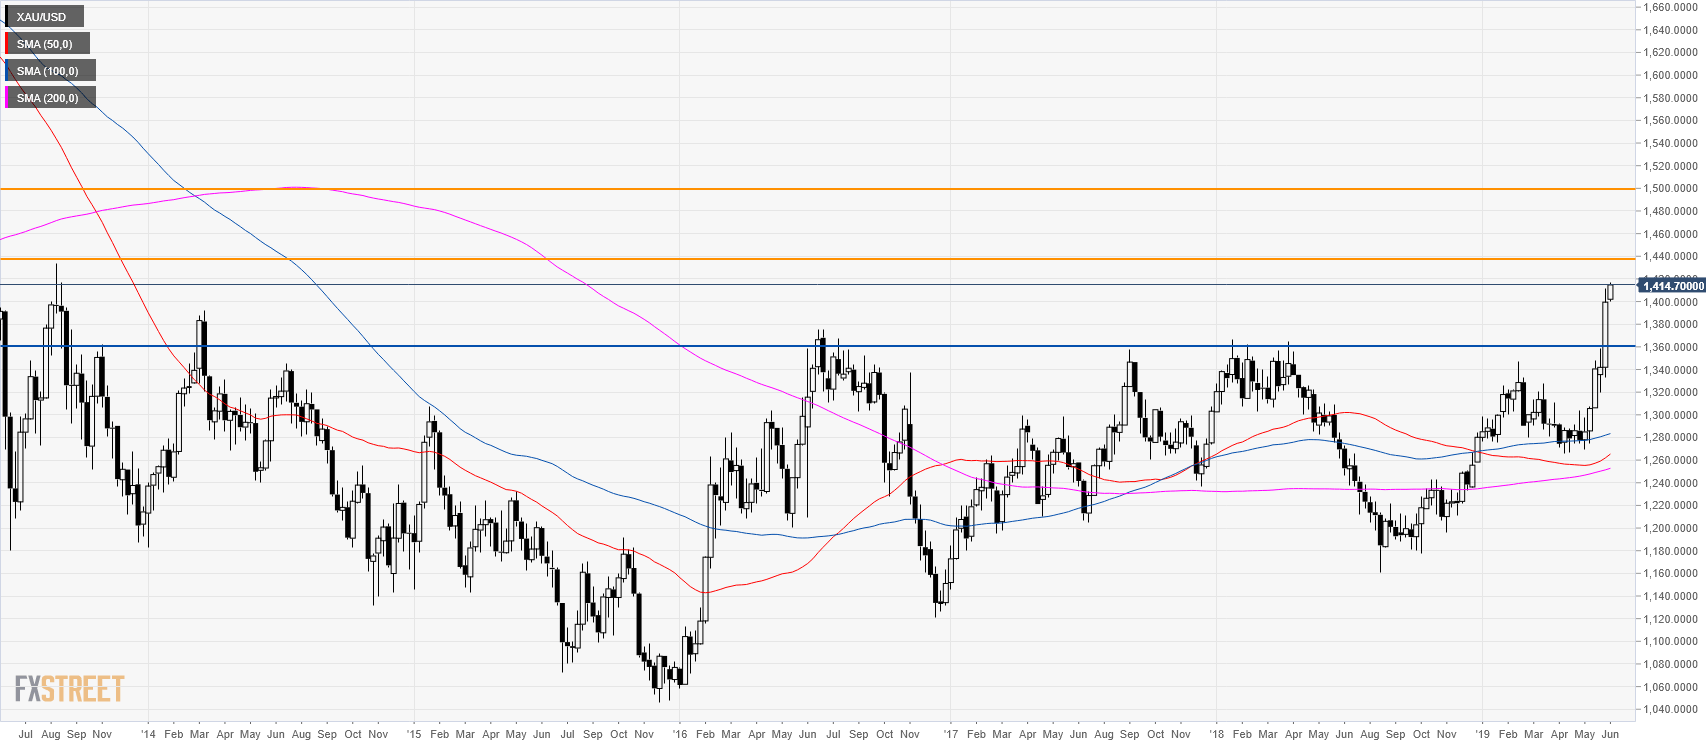
Gold weekly chart
Gold is trading at its highest since September 2013. The market is in a bull trend above the weekly simple moving averages (WSMAs). 1,433.82 August 2013 swing high can be the next resistance followed by the 1,500.00 handle.

Gold daily chart
Gold is trading above its main simple moving averages (SMAs) suggesting bullish momentum. Support is seen at the 1,400.00 mark and at the 1,360.00 level.
-636969959323923999.png)
Additional key levels
