- USD/IDR lacks momentum inside key technical levels.
- RSI weakness during the latest pullback increases the odds for an upswing.
Despite taking a U-turn from medium-term support-line, the USD/IDR pair refrains from pleasing buyers as it takes the rounds to 14,150 during early Tuesday.
The pair presently struggles inside 20-week old ascending trend-line and 100-day simple moving average (100-DMA). However, weak response to the latest downturn by the 14-day relative strength index (RSI) seems favoring buyers waiting for a breakout above 100-DMA level of 14,208.
In doing so, 14,300 and a month-long descending trend-line at 14,364 can act as immediate resistances ahead of fueling the quote towards 200-DMA level of 14,420.
Alternatively, a downside break of 14,083 support-line can trigger the pair’s fresh declines targeting 14,000 round-figure whereas April month low near 13,974 and February bottom surrounding 13,860 may entertain sellers afterward.
USD/IDR daily chart
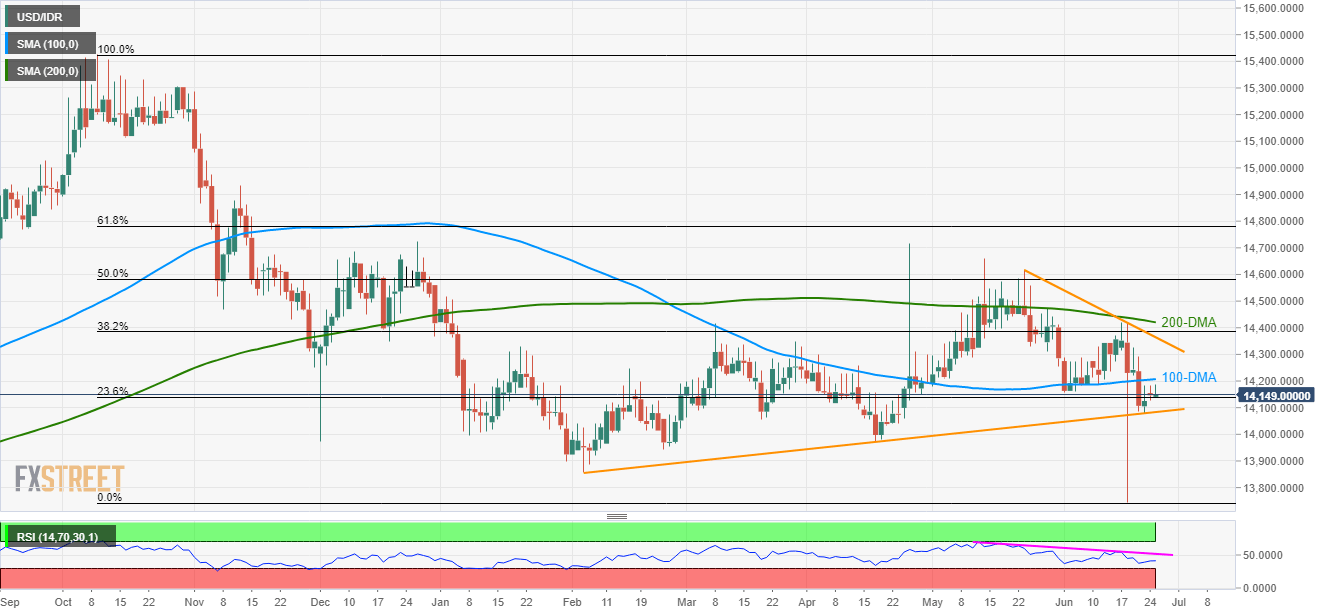
Trend: Sideways
